


The invasion of Ukraine by Russia and the economic sanctions that followed
Ukraine gained its independence after the collapse of the Soviet Union in 1991. Since then, tensions between Ukraine and Russia have ebbed and flowed, depending on how closely aligned Ukraine’s leadership has been with Russia and Europe. A full accounting of history between the two countries is outside the scope of this article, but here’s a good summary.
However, on February 24th 2022, a red line was crossed. Putin authorized “special military operations” and moved 190,000 troops into Ukraine. Russian forces also conducted missile and artillery strikes on major Ukrainian cities.
Two days later, on February 26th, western countries imposed new sanctions on Russia, which at a high level, came in three forms:
- Restrictions of Russia’s ability to transact in USD (delivered by the US government through its financial institutions, with major carve outs for energy trade, however).
- Expulsion of Russian banks from the global payment network (SWIFT) (delivered by the European Union since SWIFT is headquartered in Belgium).
- Unprecedented restrictions imposed to the Russian central bank from accessing its reserve. More on this next.
Russia is cut off from its foreign reserve
After Russia annexed the Crimea peninsula, it took measures to reduce its dependency towards the dollar. It decreased its dollar reserves to just 16% of the central bank’s stockpile in 2021 (down from more than 40% in 2017). Russia also began spreading its reserves to other countries, specifically China and Europe (see Figure 1 below). After all, as Europe imports about 40% of its natural gas needs from Russia, surely the Europeans would be beholden to Moscow?
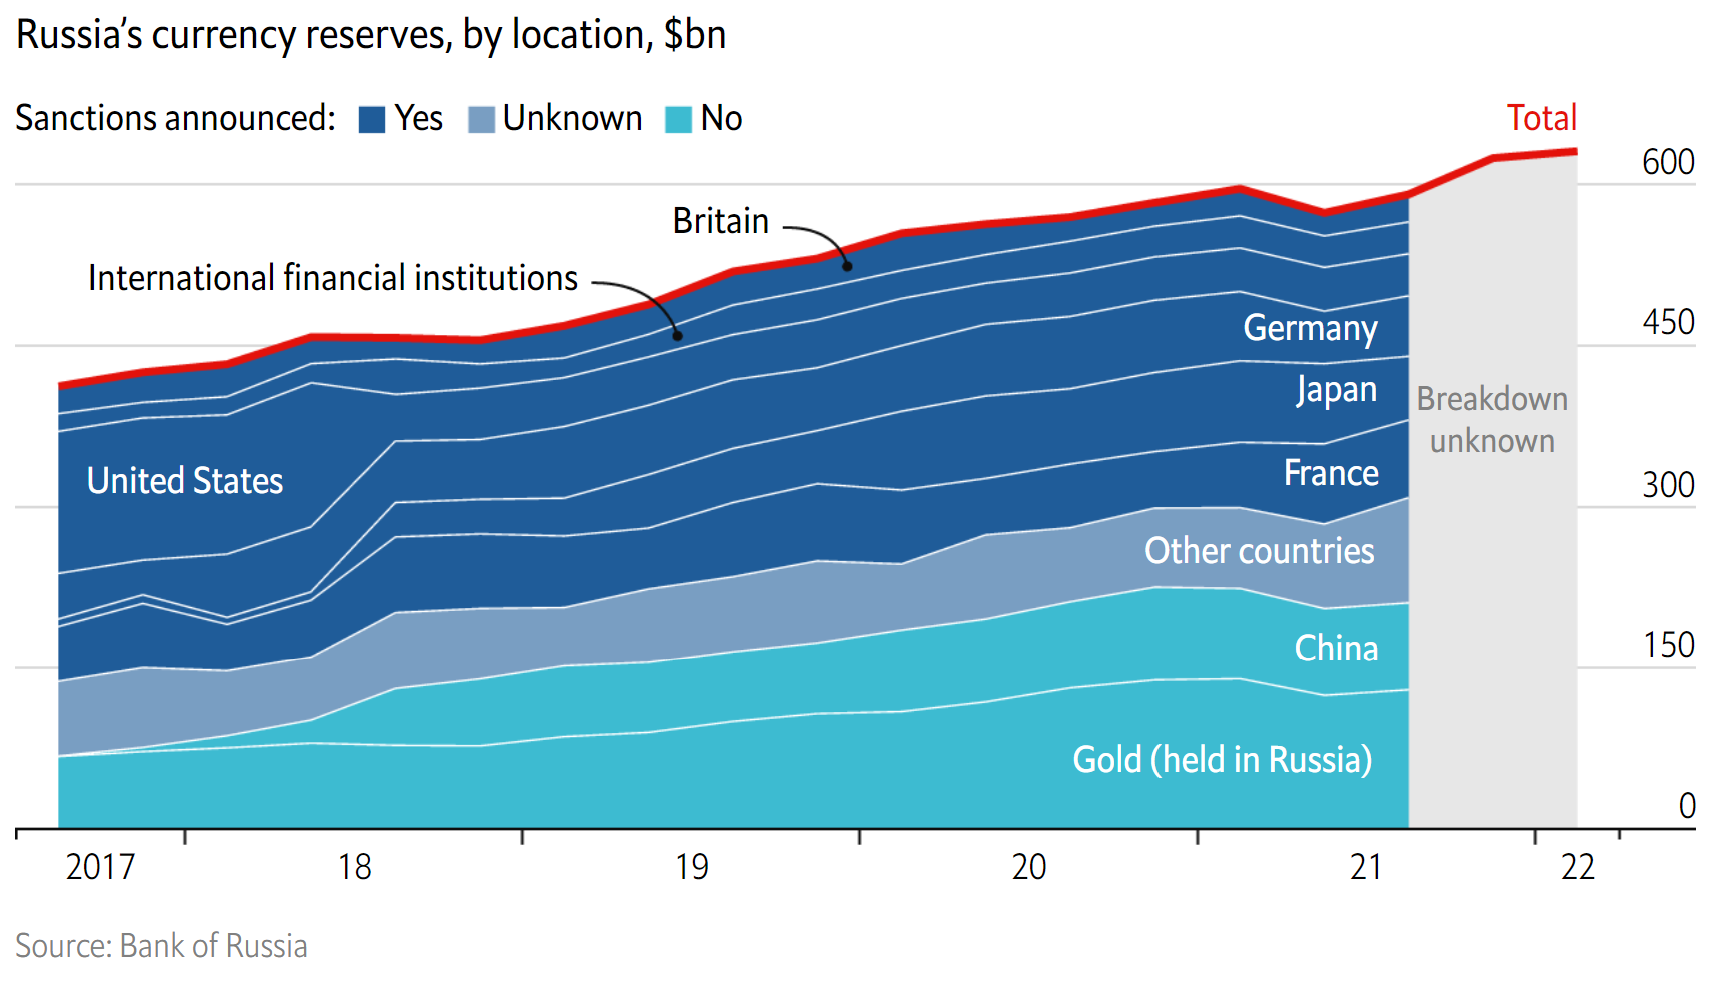
So now, Russia’s Central Bank has lost access to about half of its $600 billion (or 38% of its 2021 GDP) currency reserve (the dark blue area in Figure 1 above), and a significant portion of its reserve in gold (about $150 billion) is illiquid (it’s probably hard to find a buyer for that now).
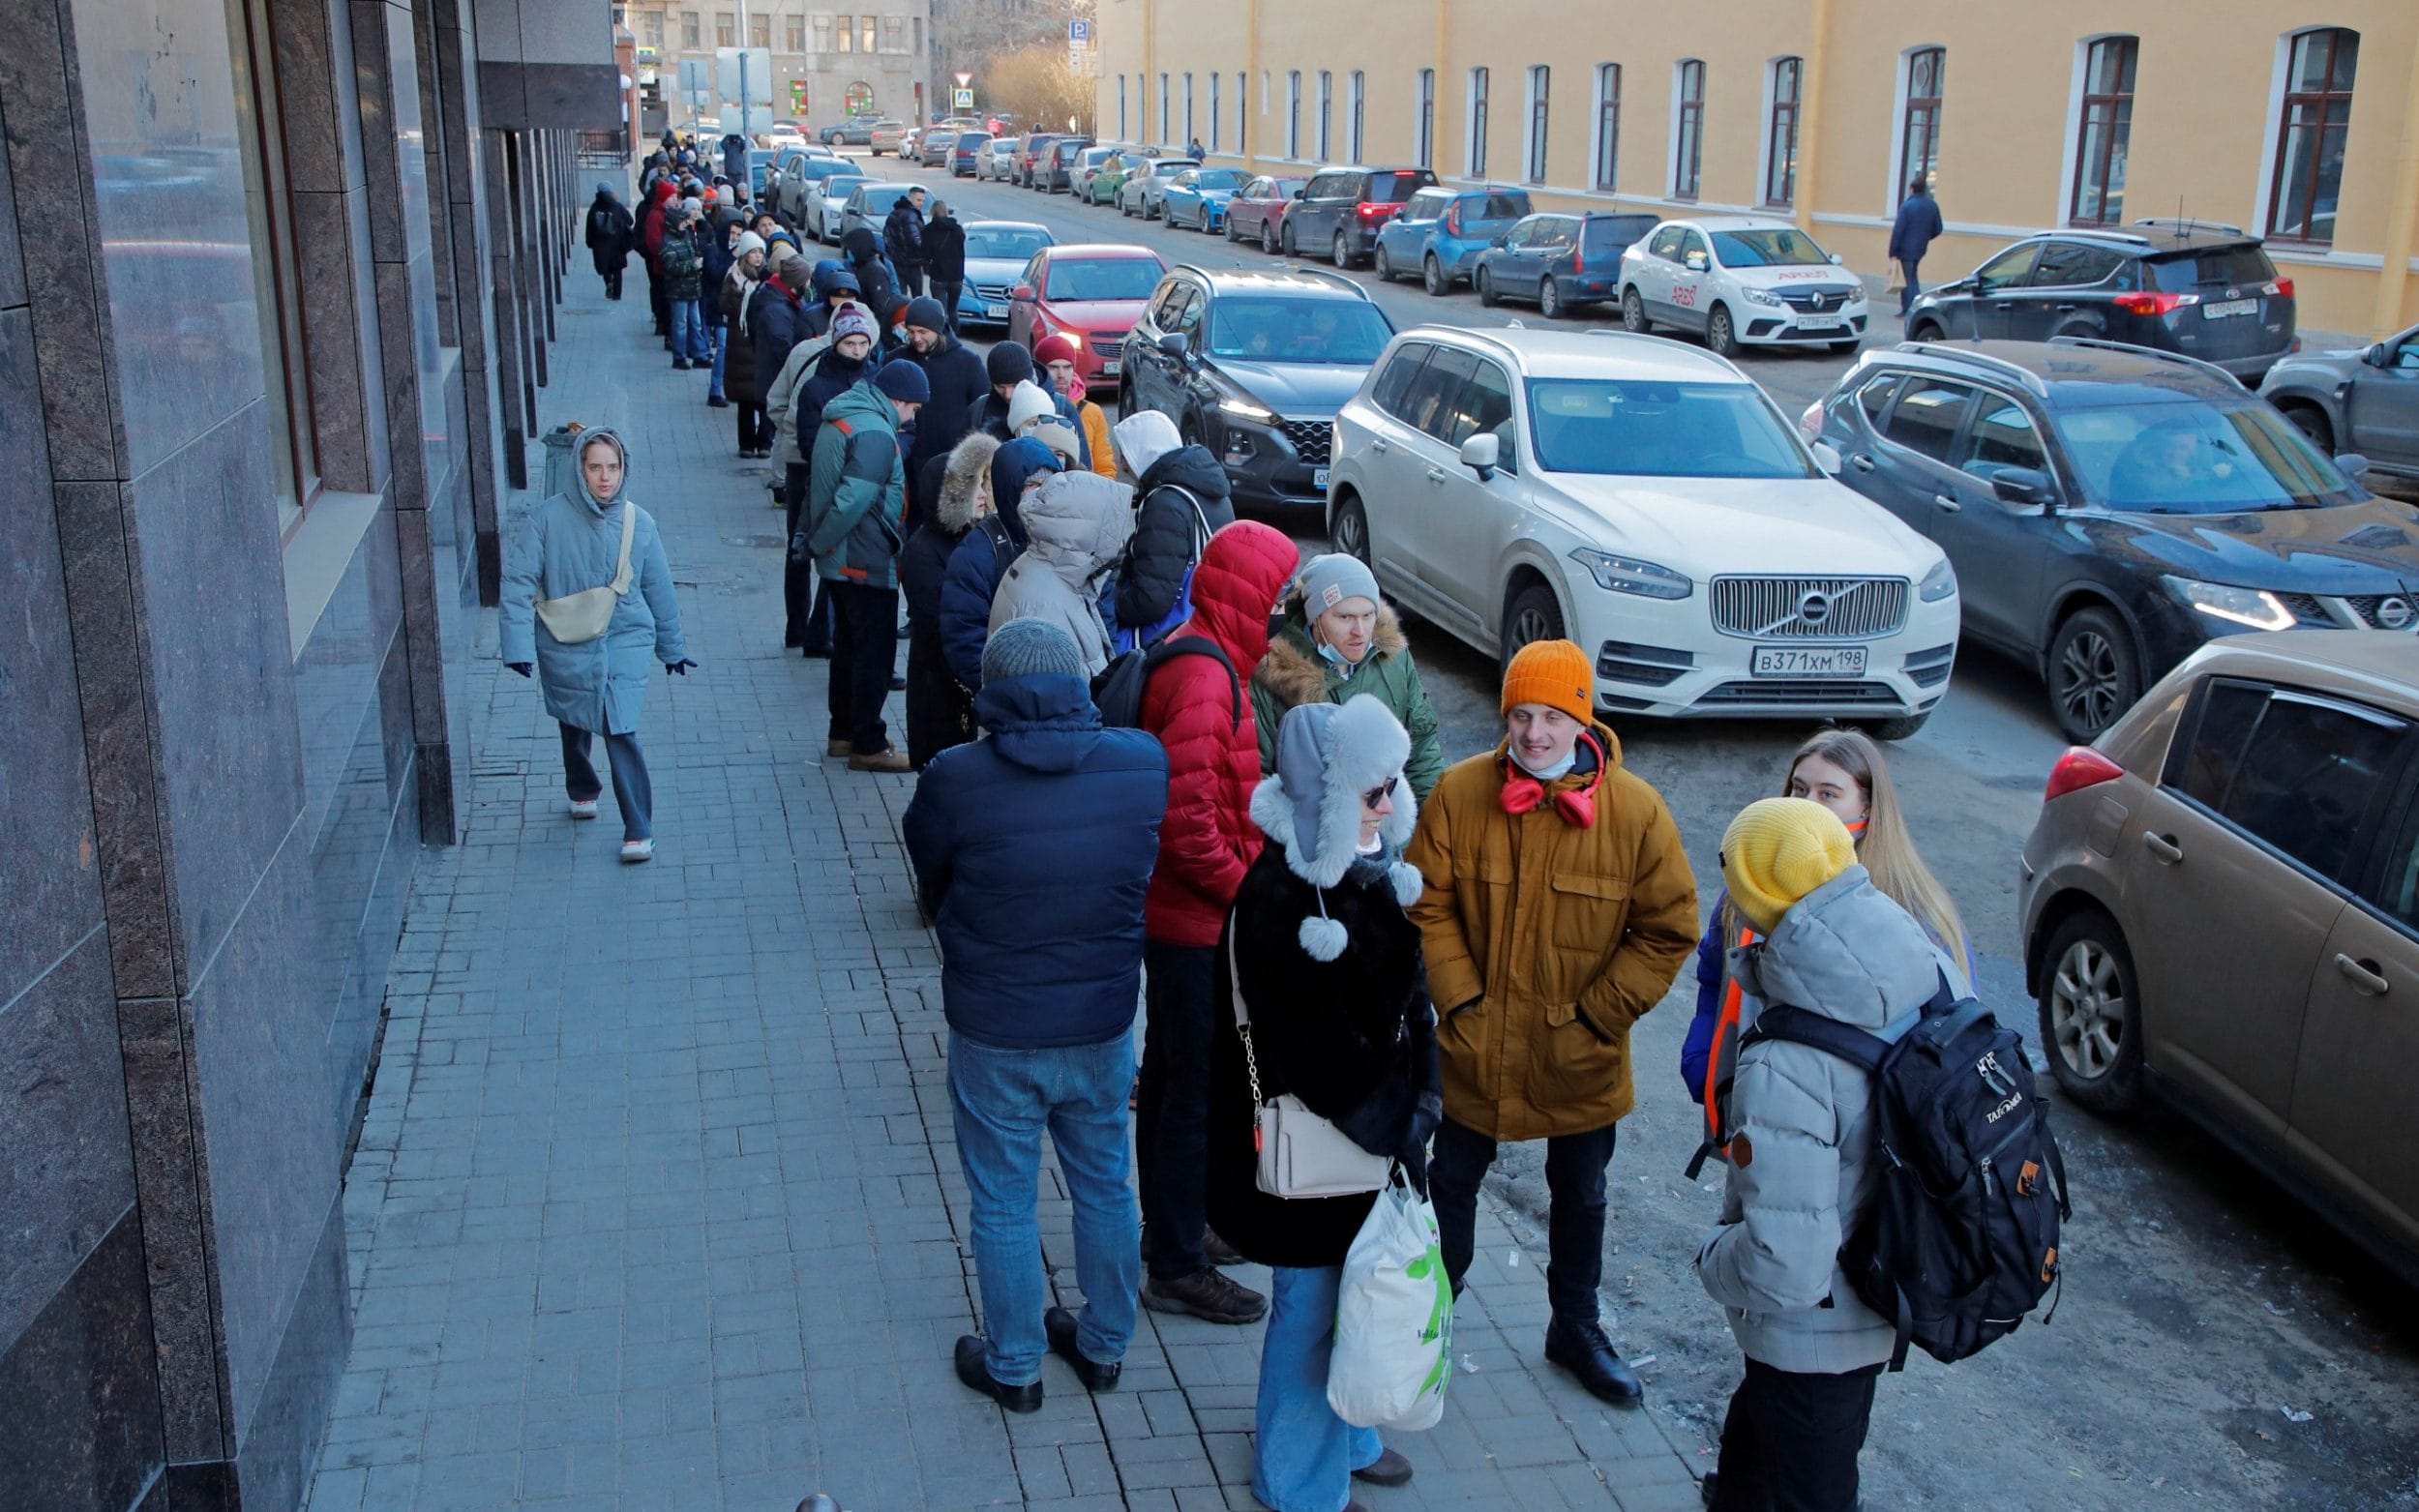
The implication of this is significant. This severely limits the ability of Russia’s central bank to support the value of the Ruble, which has declined by 38% (as of this writing), and to provide liquidity to domestic banks, especially at a time when a bank run is occuring.
The rapid devaluation of the Ruble can lead to hyperinflation, especially considering that the country is highly reliant on imports (about 21% of its GDP) which is denominated in foreign currencies.
Note, this is why replacing the USD as the global currency is extremely difficult. Even when the US accounts for only 10% of global trade, the USD accounts for almost 50% of global trade and 60% of global currency reserves. This is because the currency is stable, deep, and freely traded (unlike China’s Yuan).
The closing of the Russian stock market
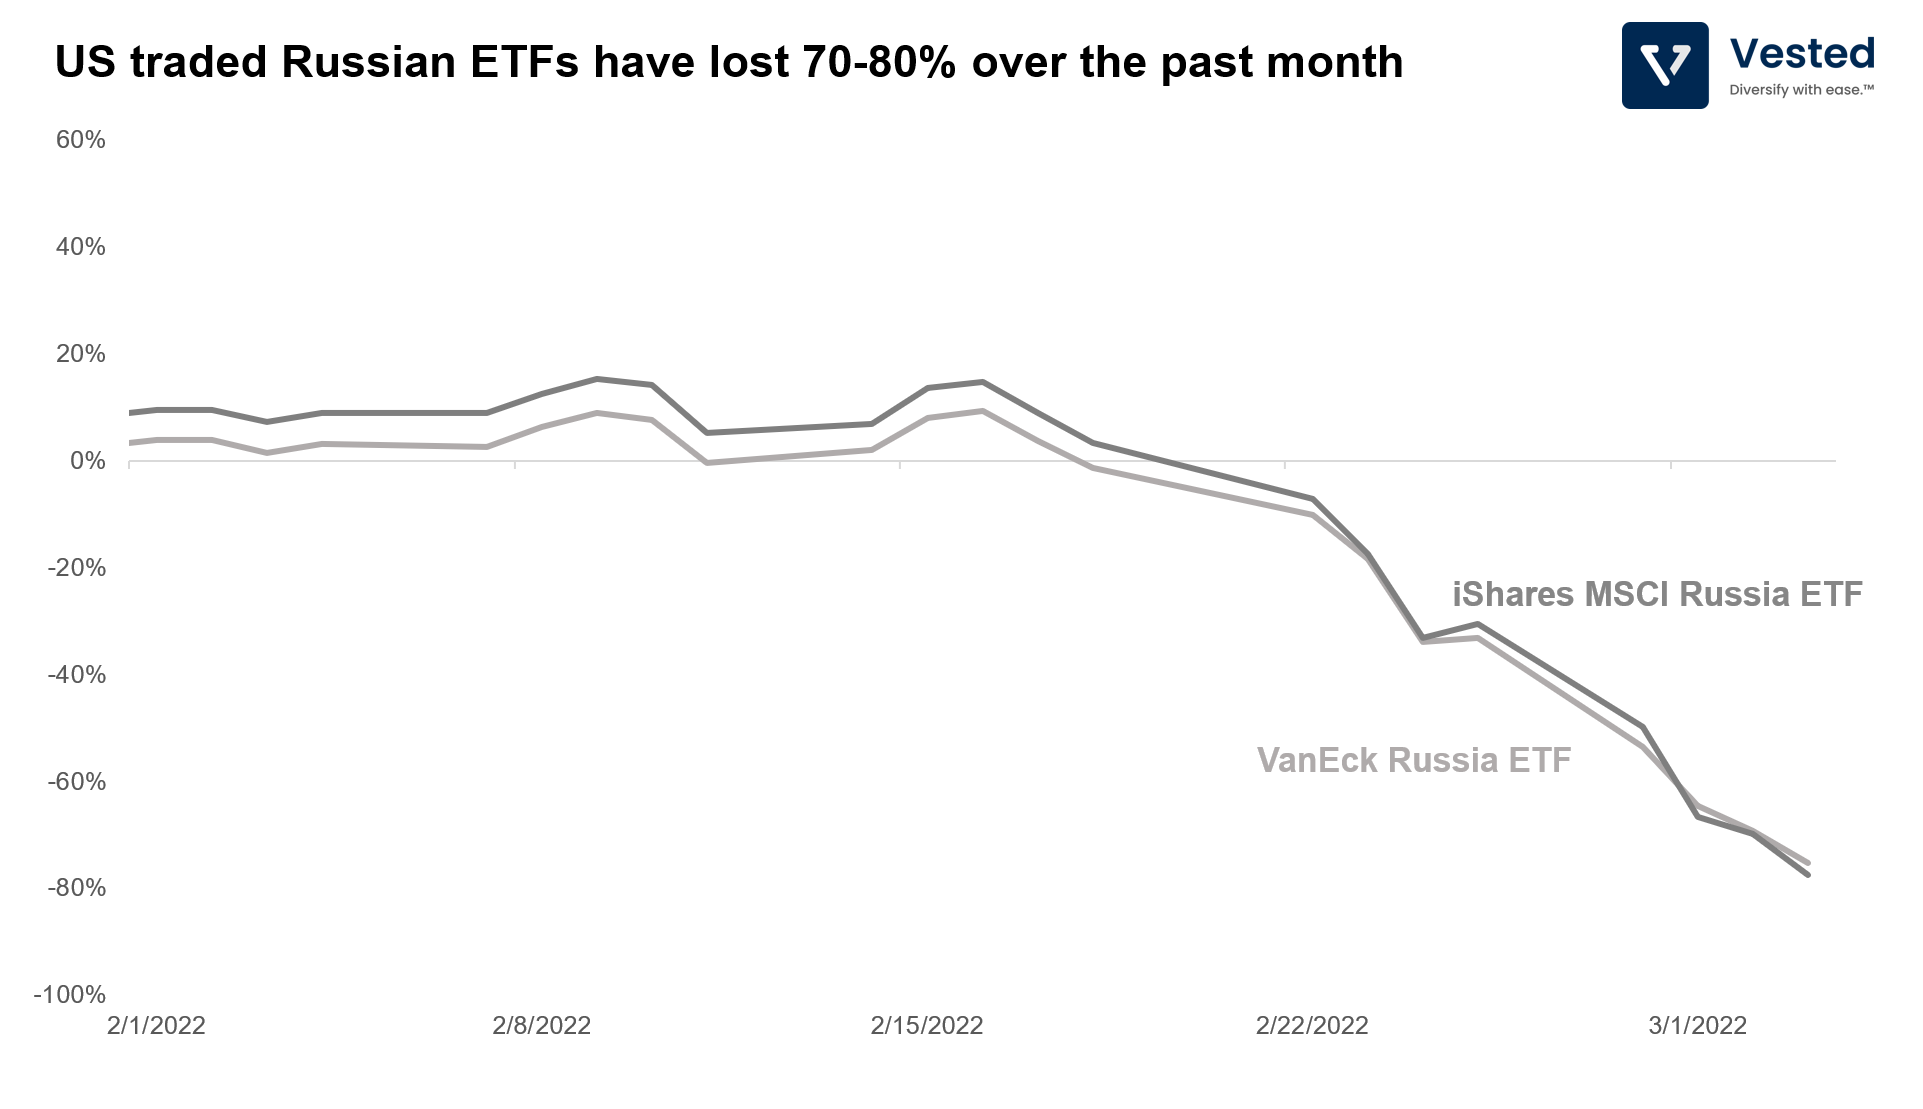
Beyond inflation and devaluation of its currency. The Russian economy experienced rapid devaluation of its equity markets. With everyone selling and no one buying, prices cratered rapidly. US-traded Russian ETFs have lost 70-80% of their value (see the 1 month returns of iShares MSCI and VanEck Russia ETFs in Figure 2 below).
To stop the bleeding, the government has closed the Moscow Stock Exchange until at least March 9th. As a result, major index providers have deemed Russian equities to be ‘not investable‘ and are in the process of removing them from the global index.
For its part, the Russian government is blocking foreign investors from selling their equities, and to support its market, has announced that it will deploy up to $10 billion to buy up local equities.
The implications for China
For China, the financial tools that the West is employing to counter Russia provides a preview of what would happen if a war over Taiwan occurs. Currently, China has about $3.3 trillion in reserve. Although the exact composition and distribution of this reserve is a state secret. It is likely distributed over various major currencies and foreign government bonds (according to the Fed, as of Dec 2021, China owns a little over $1 trillion in US Treasuries), held in western financial institutions.
The lesson for China is that reduction in reliance on USD is not sufficient to insulate itself from the West’s financial sanctions, nor it is sufficient to build its own payment network (China has its own version of interbank payment that competes with SWIFT called the CIPS). There’s a risk of China losing access to its vast currency reserve if there’s a multinational effort to do so.
The economic implications for Europe and the US
The largest impact of the sanctions is likely the cost of energy. Russia is the world’s largest exporter of oil to global markets (the second largest crude oil exporter behind Saudi Arabia). Since the war began, energy prices have sky-rocketed, both in the US and in Europe (Figure 3 below).
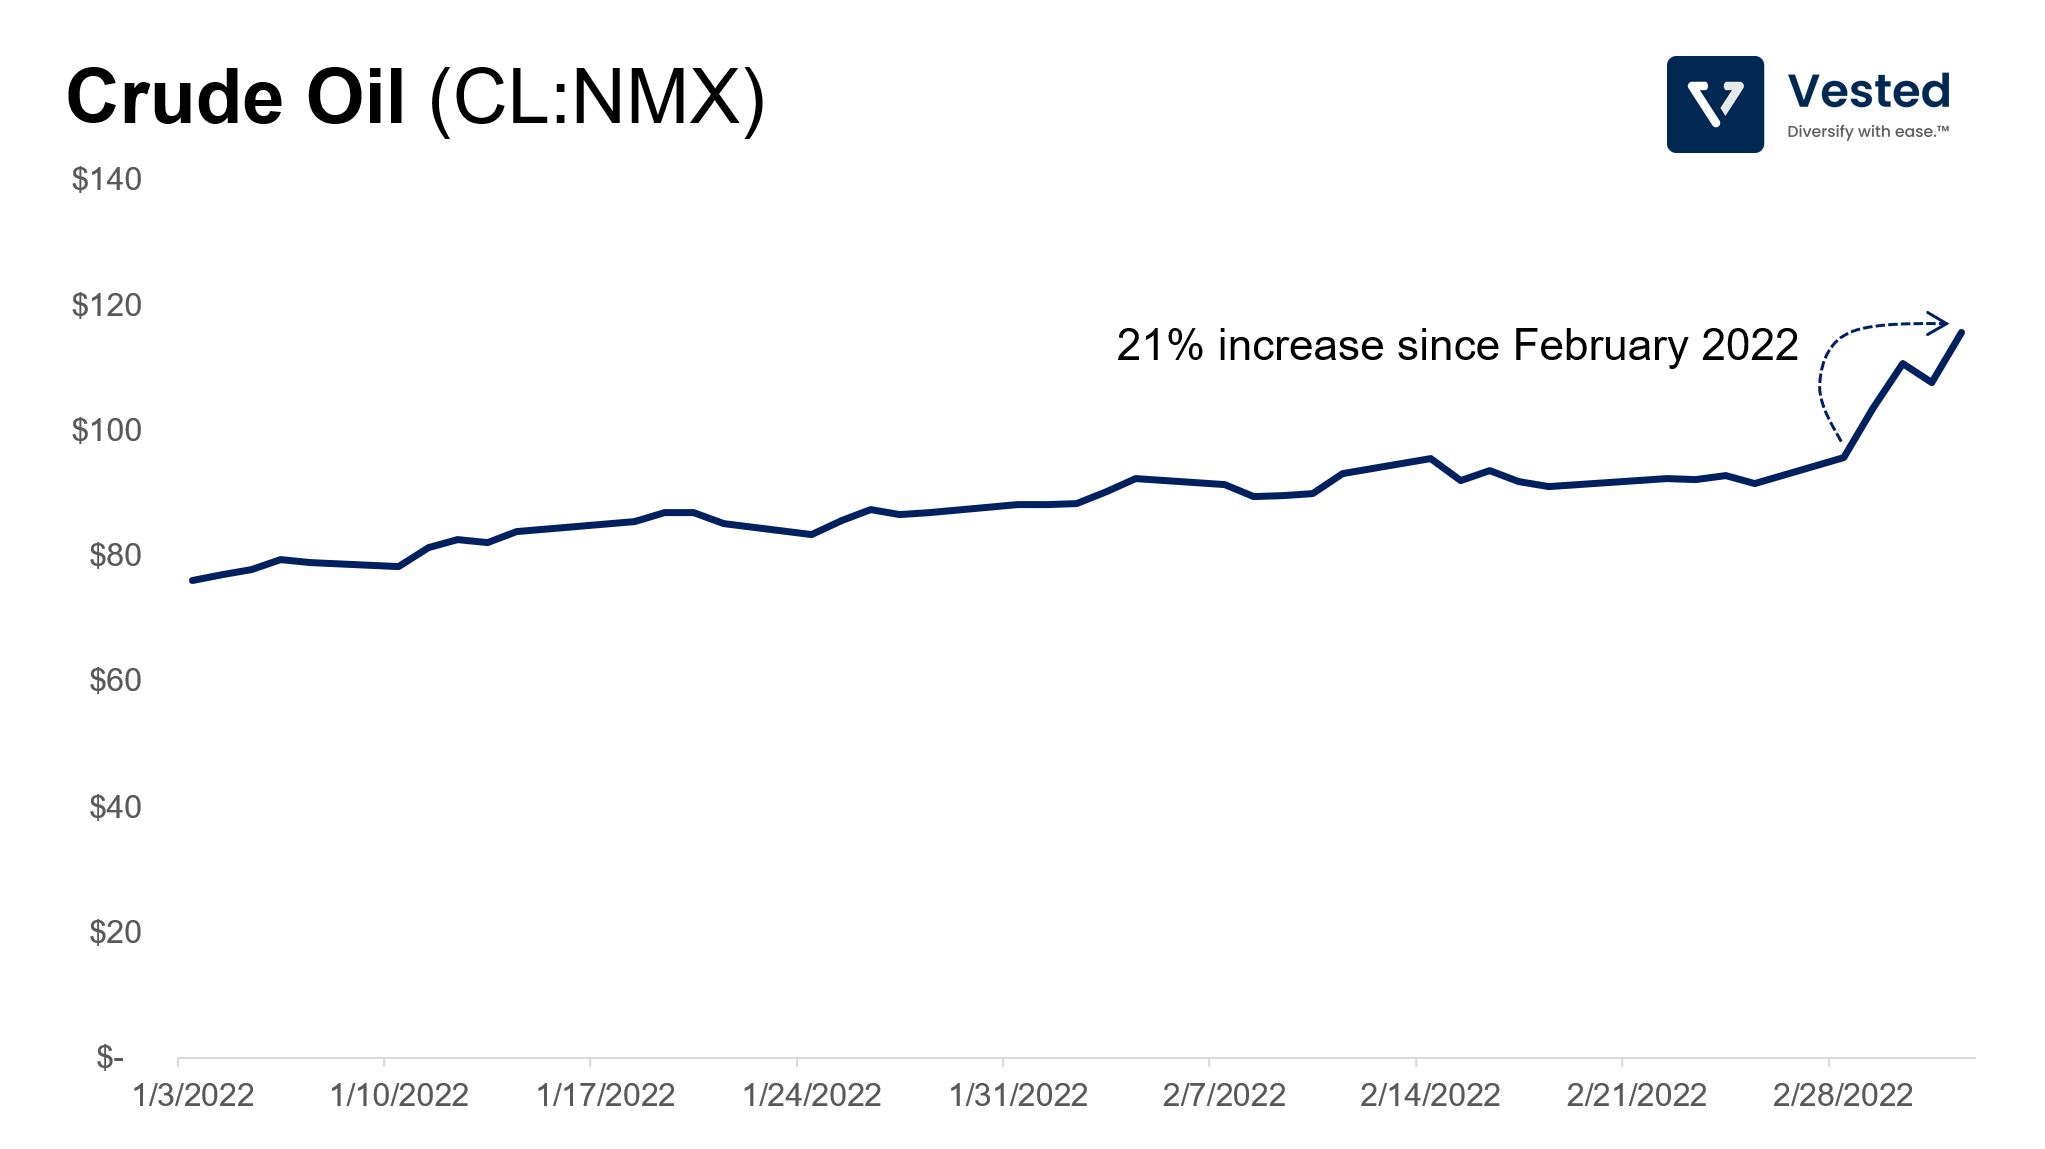
The price increase is experienced more acutely in Europe. European natural gas spot prices have doubled when compared to the beginning of February. Meanwhile crude oil prices have jumped by more than 20% (see Figure 3 above). The increase in energy prices can add to inflation concerns.
Traditionally, inflation is governed by supply and demand dynamics. When the economy is growing, demand for goods and services by consumers increase, driving up prices – the inflation rate goes up. When this happens, typically Central Banks increase interest rates to increase savings rate (and in turn reduce consumption and make borrowing more expensive). This has the effect of lowering the demand side and therefore slowing down the economy to prevent it from overheating.
It’s a bit of an oversimplification, but it’s an important dynamic to understand. When the pandemic hit two years ago, the European Central Bank and the Fed (the US Central Bank) reduced interest rates and injected a lot of liquidity into the global economy, thereby boosting demand. The supply side has not been able to keep up since the pandemic caused disruption in the global supply chain. This supply and demand imbalance has caused the elevated inflation that you’ve been seeing in the past 6 months or so.
The expectation is that this inflation is temporary. Once the supply side is sorted out, prices will return to normal levels. This is traditionally true, since opening up more factories to increase supply has historically been easier. But the problem with inflation is that it is also about expectations and can take on a life of its own. The longer the temporary inflation lasts, the longer people expect it to last. This has the trickle down effect of not only more permanent increase in prices, but, more importantly, in wage increases. Higher wages are sticky. Prices can come down, but you cannot reduce salaries (unless of course a recession and massive layoffs occur). This makes inflation more permanent. As it is, many US firms are forced to conduct multiple pay adjustments per year, while also coping with the great resignation. These are signs of the market hitting full employment.
But the phenomenon above will not break the supply and demand dynamics. It will only increase the demand side. While this further increases inflation, it is at least accompanied by economic growth. However, there can be a situation where the supply and demand dynamic is broken. If prices increase without the commensurate demand increase, we get stagflation.
Stagflation happens when prices increase, but the economy is not growing. This means prices increase not because of demand increase, but because of long term supply disruption leading to increased input prices. The most famous period of stagflation was in the 1970s, where the world saw two energy crises (the 1973 Arab oil embargo and the 1979 Iranian revolution). It resulted in a bad combination of double digit inflation, high interest rates, and high unemployment.
Today, the increase in energy prices we are seeing due to the Russian invasion has echoes of the past. Increase in fuel prices in a relatively high inflation environment can lead to stagflation. Stagflation is tricky because the Central Banks (both in Europe and the US) have to fight two problems at the same time, with an imprecise tool (interest rate hikes):
- On one hand, the Central banks can raise interest rates to lower demand, and therefore reduce economic growth in the hope to tame inflation. However, this may have limited impact on inflation levels if price increases are due to higher energy costs.
- On the other hand, if Central banks don’t do anything, both high demand and high fuel prices will cause inflation to go out of control
What are the odds of stagflation?
There are differing opinions on the subject. While the past is useful in predicting the future, there are two key differences between the current situation and the situation in the 1970s.
The first is economic strength. During the stagflation period in the 1970s, the US economy was weak. The 1973 oil embargo came at the heels of a recession. In contrast, current indicators of the US economy seem to suggest that it is healthy: unemployment is near record low levels, wages are increasing, consumer spending remains robust, and corporate earnings are still growing.
The second is energy independence. Unlike in the 1970s, the US is currently more insulated from an energy crisis. Thanks to the shale revolution, the US has become one of the world’s largest oil and gas producers. At high oil prices, shale oil is profitable (their cost basis requires a breakeven price of around $50/barrel of oil). This means that drilling activities in the US will intensify, and fortunately, unlike traditional oil and gas projects that may require years before producing output, shale oil drilling takes only weeks. Oil supply in the US is more elastic.
Europe, however, is not so lucky. Lack of energy independence really hurts their ability to counter Russia. It is estimated that Europe is paying about $690 million per day to Russia for oil and gas, which of course, undermines the economic impact of the sanctions.
Investing in high inflation conditions
One way to hedge your portfolio against inflation is to invest in inflation protected bonds (for example: TIPS, SCHP). Some flee to the safety of gold (for example: GLD, IAU). Others invest in commodities. Here are three areas to consider:
- Production: There’s an argument to be made that we are at the eve of a commodity supercycle. The last time this happened, it was in the 2000s, driven by demand for infrastructure in emerging countries, especially China who at the time was rapidly industrializing. Currently, with the backdrop of de-globalization, many countries, including the US, are recognizing the importance of being self-sufficient. This means more investments in domestic industrial capacity, which require a robust supply of materials: aluminum (for example: ALCOA), steel, and other metal supplies (for example: RIO, VALE).
- Transportation: All these commodities need to be transported across North America. Transportation via rails is about 3x cheaper than trucks, so rail transport is important in the commodity value chain (where the material is dense and has low margins). UNP and CSX are the two largest publicly traded rail operators in the US. These companies have been facing macroeconomic headwinds in the past decade since they lost a lot of revenue from coal shipping (coal has been out of favor). But they enjoy pricing power and strong economic moats (the US is not building new rail tracks). If commodity consumption increases in the US, they are poised to grow as well.
- Berkshire Hathaway: If stuff is going to get more expensive, a good approach might be to own a business that owns, builds, and sells the most stuff. The holding company owns a broad set of businesses (which includes insurance, energy, home, railroads, and many more). It is also one of the largest domestic infrastructure assets owners (to the tune of $158 billion in 2021). And it owns large equity investments in multiple blue chip companies (two of its largest are 19.9% ownership of American Express and 5.6% of Apple).