 Skip to content


In this blog, we discuss the trend of the aging world and its impact on investing. To help investors adapt to this new trend, we are launching a new Vest (model portfolio): the Aging Vest.
Figure 1 shows the hypothetical historical return of this strategy. The dark blue line represents the Vest performance.
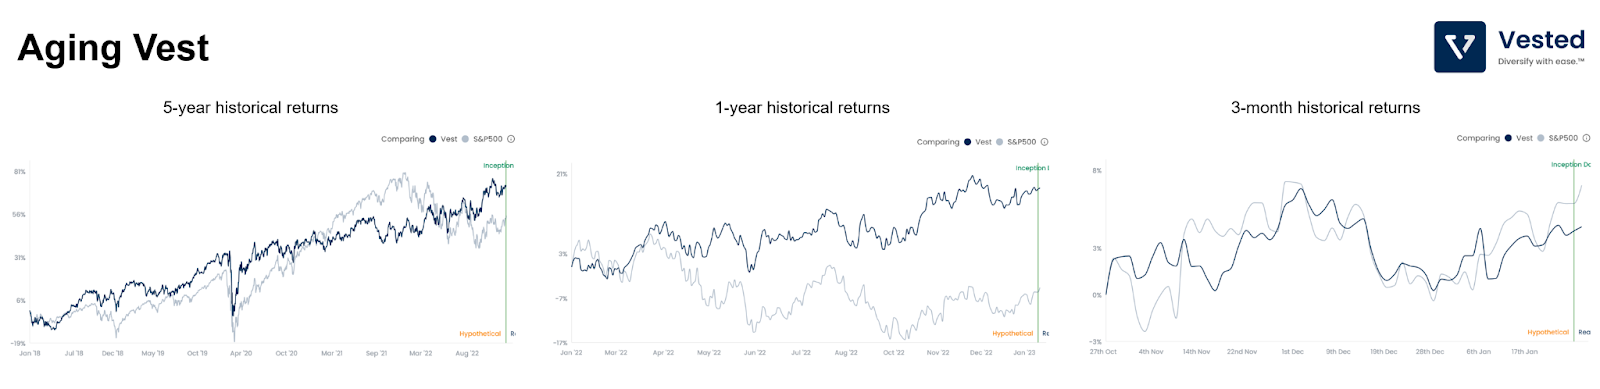
Over the past one and five years, the hypothetical return has outperformed the S&P 500 (left panel in Figure 1 above) with a more linear return profile.
Read on for more details on this strategy.
The aging world
In recent weeks, China disclosed that it had reached a pivotal moment (not a good one). Its population is shrinking. Beijing reported that last year, it had 9.56 million births and 10.41 million deaths. The population shrinkage has been preceded by years of slowing birth rate and came earlier than most statisticians predicted.
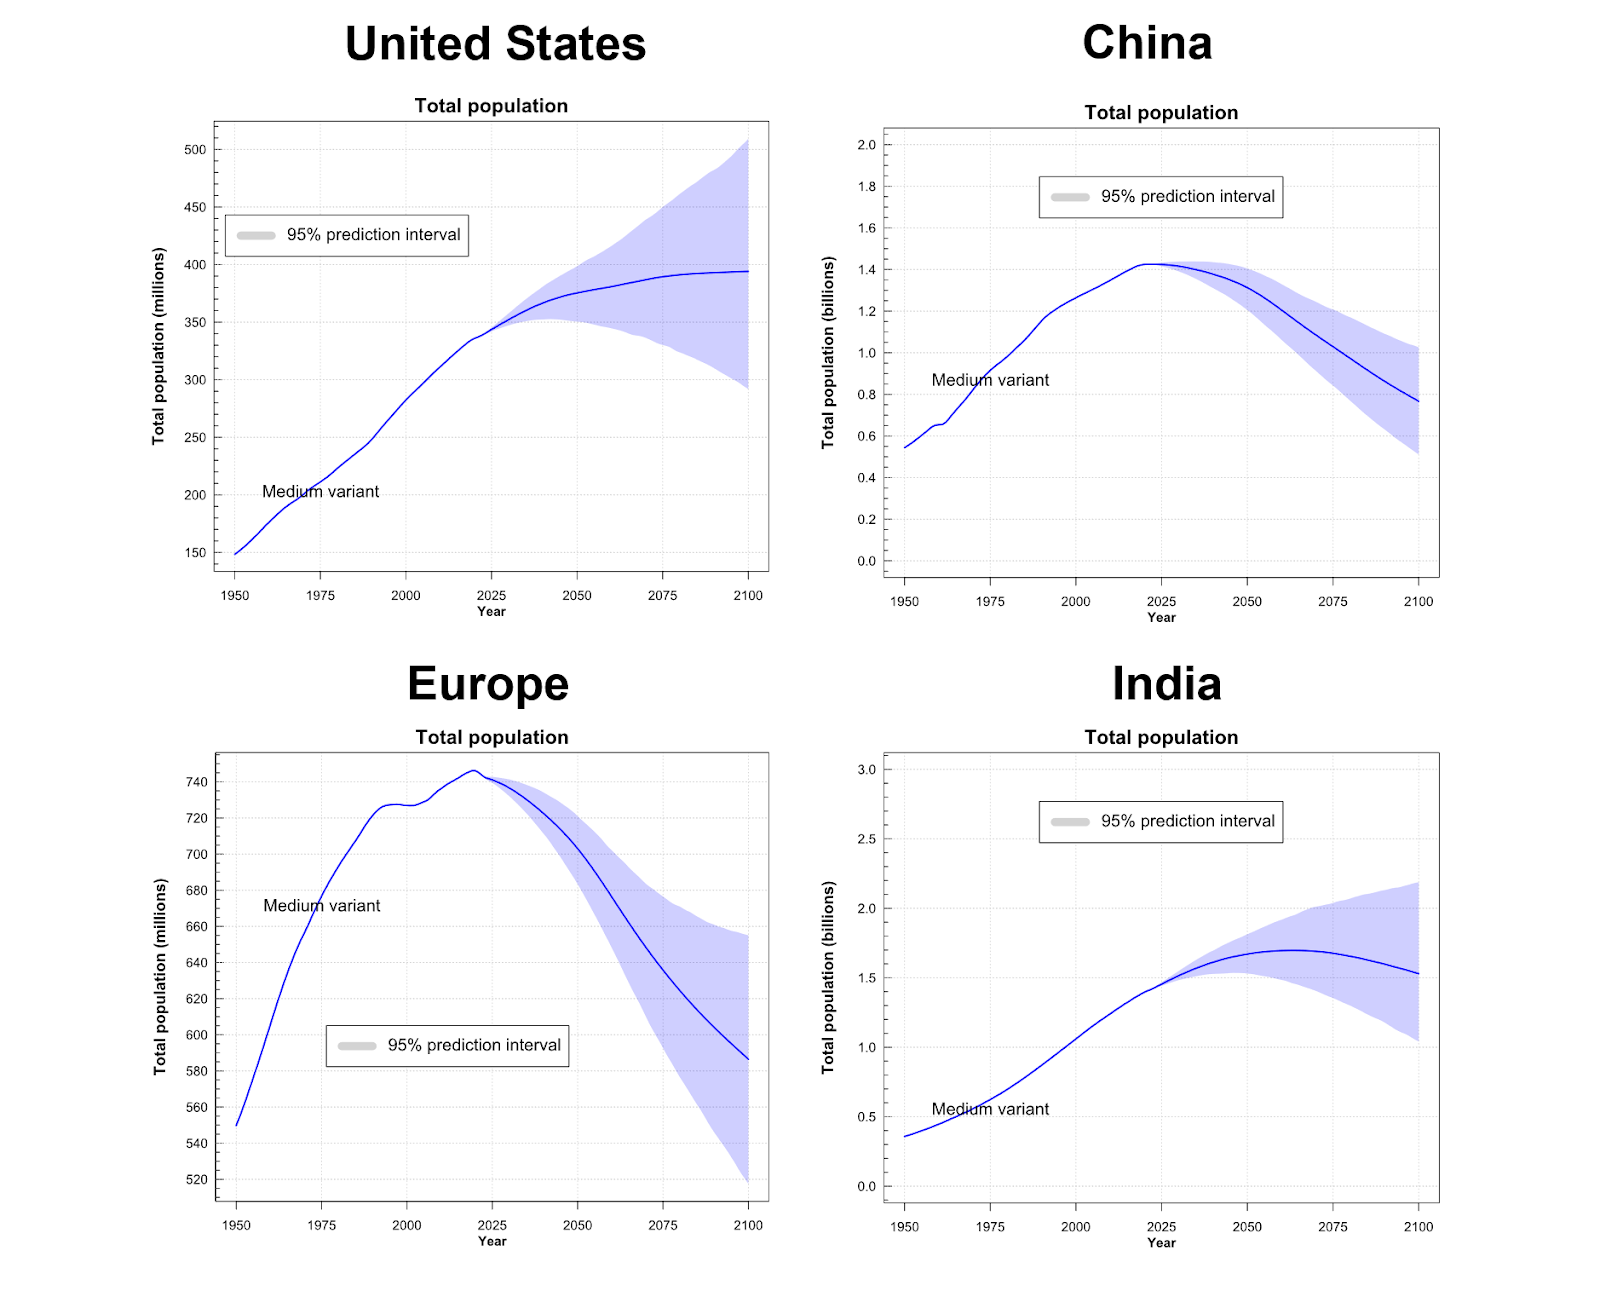
In experiencing population decline, China is not alone. As countries become richer, fertility rates decrease while life expectancies increase. This phenomenon is experienced by most countries, no matter how young their population is (for example, India’s population growth will likely plateau and decline in the next decade or so). See Figure 2 below.
Interestingly, not only is the world aging, the rate of aging is also accelerating. It took France 115 years, the US 69 years, and the UK 45 years for the proportion of those in their populations aged 65+ to double from 7% to 14%. But it took Japan only 24 years to accomplish the same rate of increase. More recently, China, Thailand, and Korea did the same in just 23, 20, and 18 years, respectively.
At 1.3 children per woman, the birth rate in China has been well below the replacement birth rate (to maintain constant population growth, the birth rate should be 2.2 children per woman) since 1990. The US is currently at 1.6 children per woman. While aging and declining population trends are often irreversible, one way to stem the population decline is immigration. This is why the US has been able to keep its population decline in check for so long (being the number one country where people want to immigrate to is a superpower in itself).
Although a shrinking population in itself isn’t the end of the world, the fact that it occurs before the country becomes rich is problematic. While China is the second largest economy in the world, its GDP per capita is ~80th in the world.
The combination of lower-than-ideal childbirth and longer life expectancy means that, over the next few decades, the 65+ population will outnumber the young (see Figure 3 below – the purple line represent the 65+ age group).
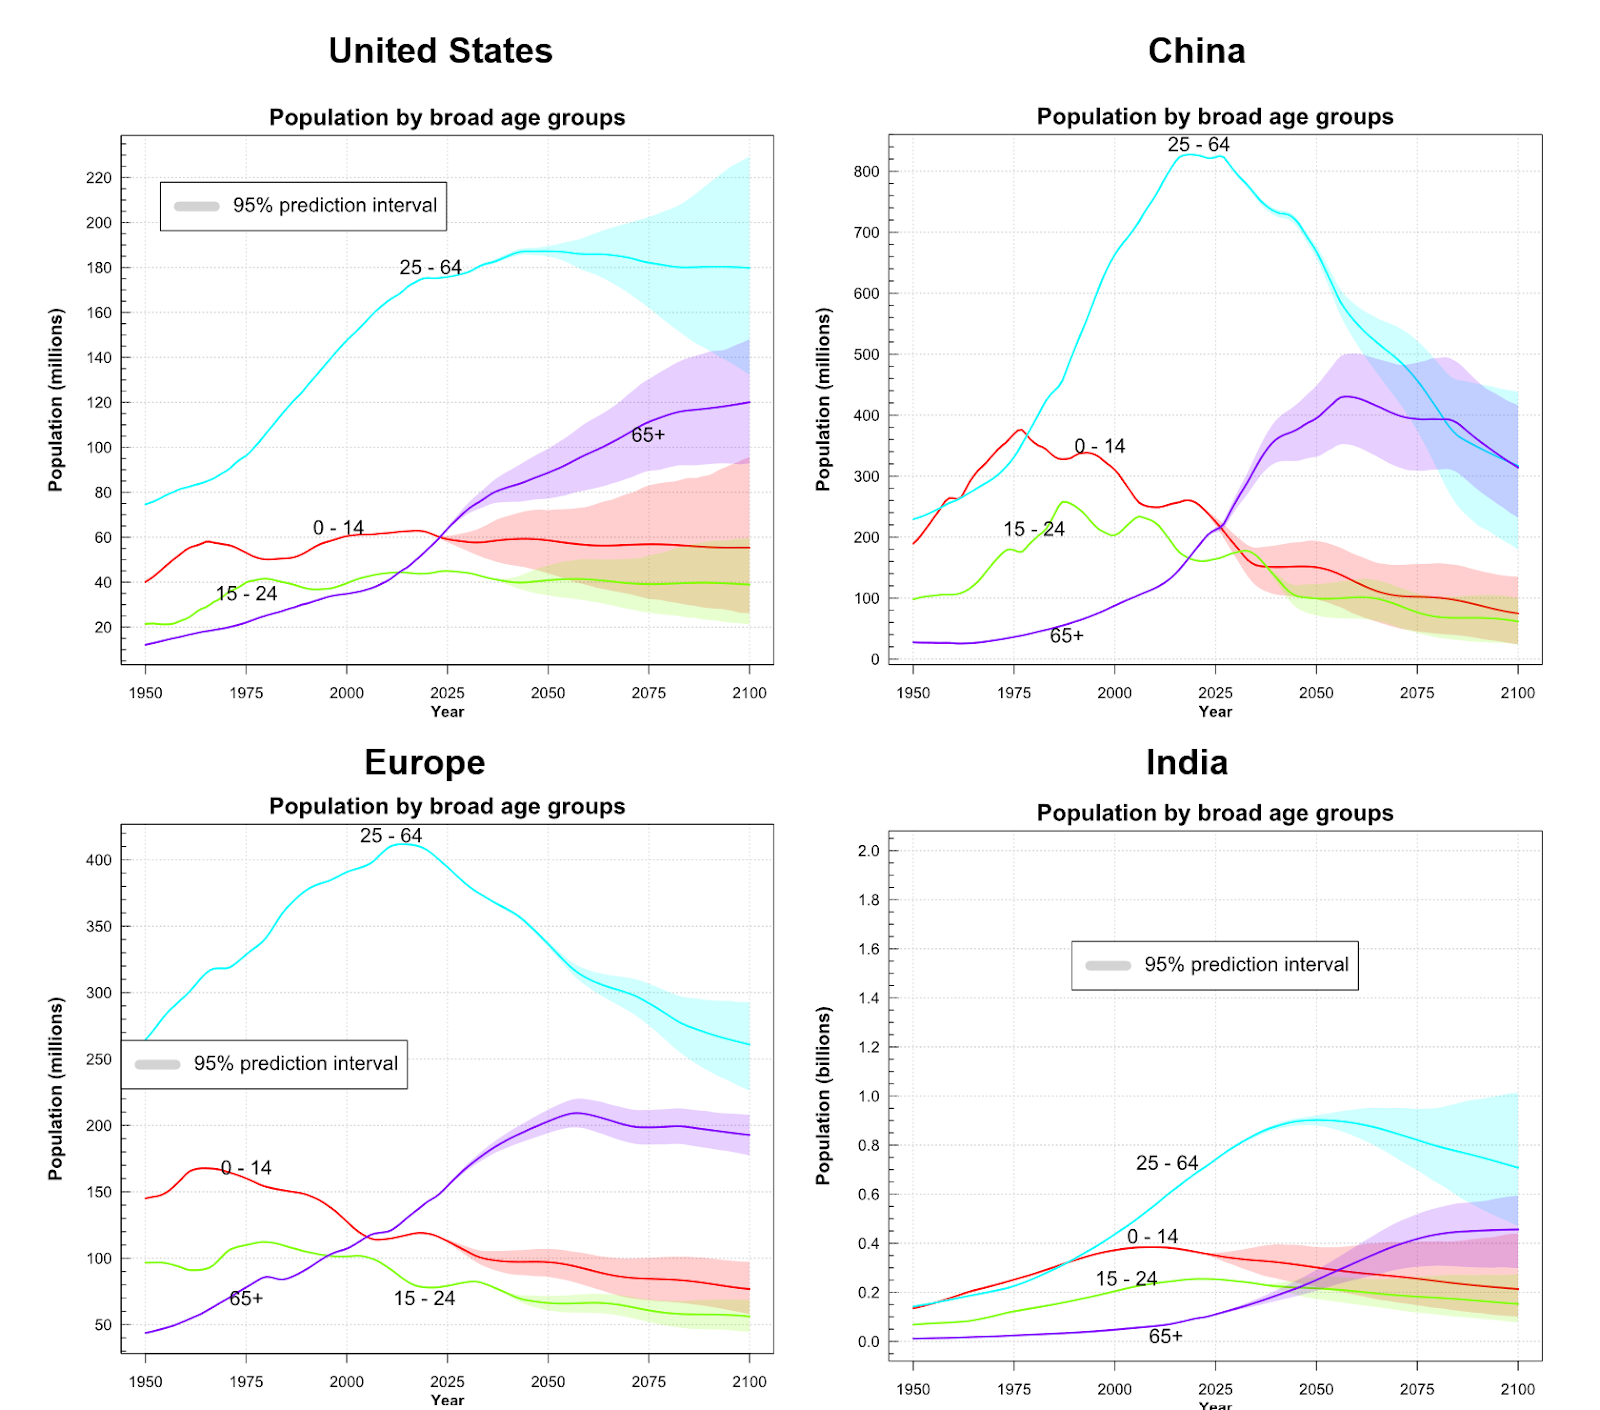
- In the US, the 65+ population will outnumber the young by 2025, while the working-age population (25 – 64 years old) will remain flat.
- In China, the population increase of 65+ and the decline of those aged 25 – 64 years old is projected to occur much more rapidly.
- In Europe, the number of 65+ years old has overtaken the number of young people.
This shifting demographic profile has significant economic implications:
- An aging population consumes more healthcare.
- An economy with an aging population requires a higher level of automation to maintain productivity.
An aging population consumes more healthcare
The older you are, the more you spend on healthcare. In the US, people over the age of 85 typically spend twice as much on healthcare as people between the ages of 65 – 84 years old, who, in turn, spend twice as much as people in the 45 – 64 years age group.
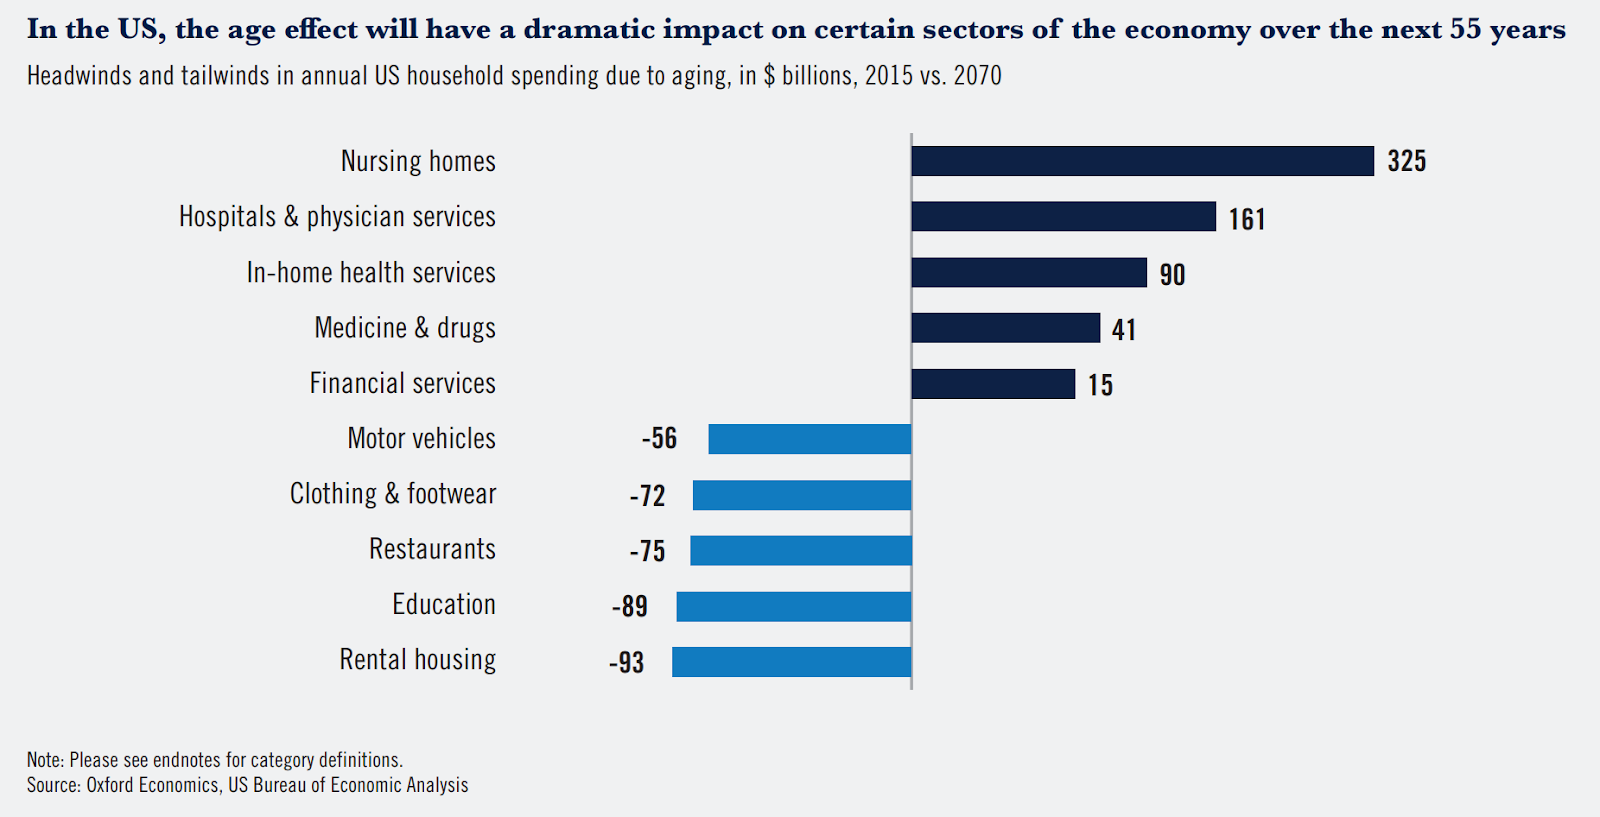
This healthcare spend can broadly be categorized into two buckets: (i) Nursing home and (ii) Healthcare services (doctors’, in-home, and medicine costs). Here’s a chart showing the breakdown of spending change between the young and the old (Figure 4 below).
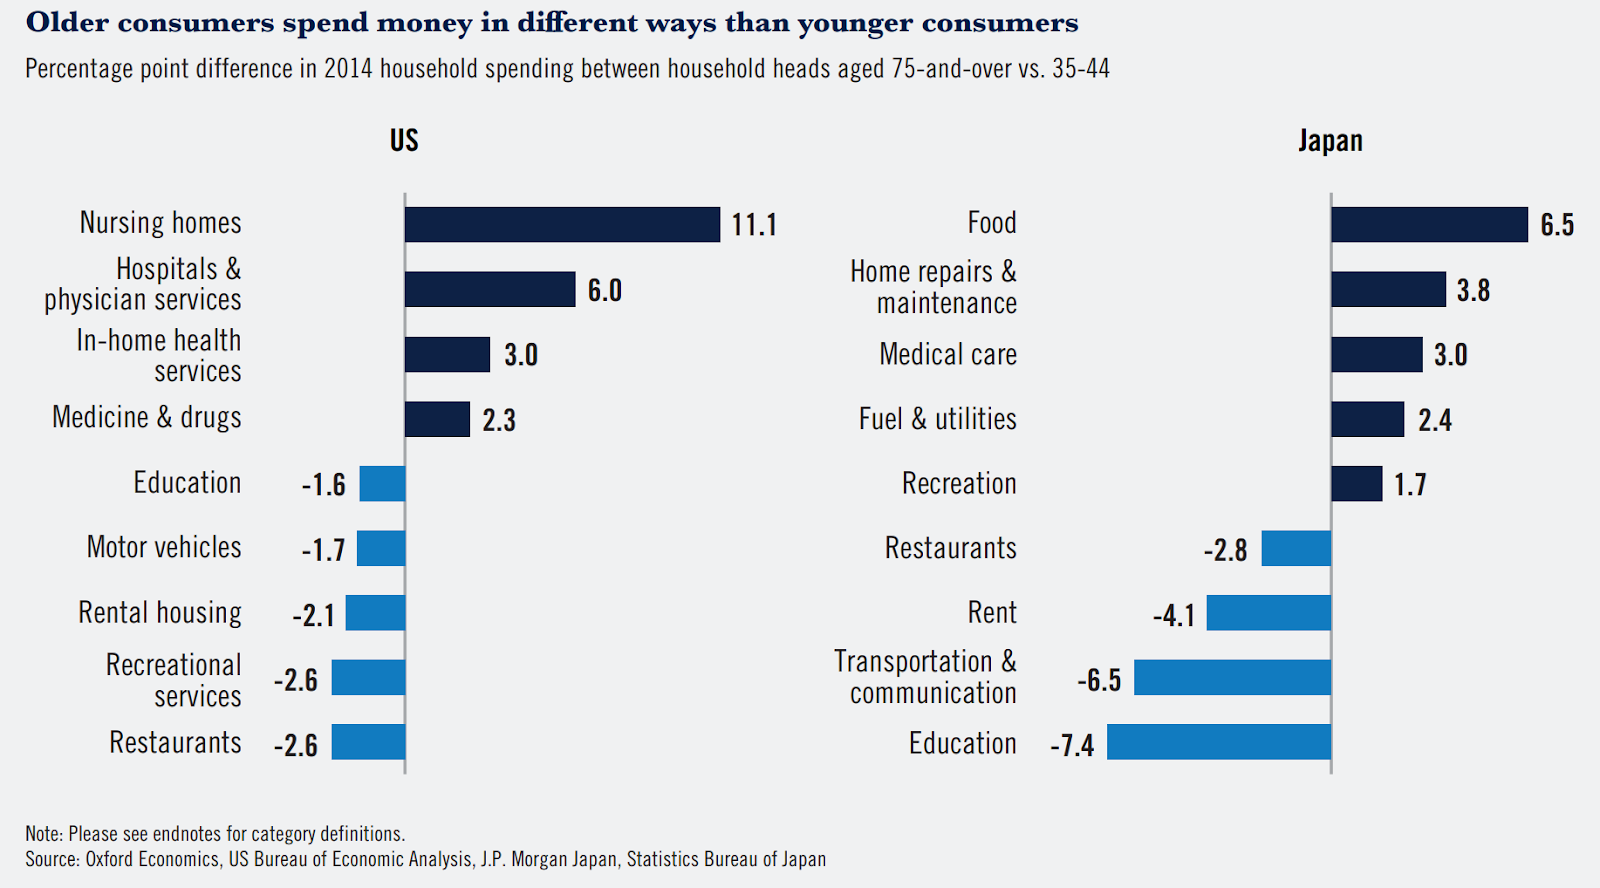
Some key takeaways:
- Notice that in the US, the increase in spending is primarily related to elderly care (nursing homes). In Asia, where there’s an expectation that older people will be cared for by their children, the same cultural norms are less prevalent. This means more elderly people are moving into nursing homes in the US.
- With increased life expectancy, the rate of chronic illness increases as well. Spending on healthcare services, medicine, and drugs goes up.
- Older demographic typically spends less on rent, recreational services (except cruises!), and restaurants.
Zooming in on the US, the age impact will have a profound impact on spending on the verticals mentioned above. By 2070, it is projected that the annual US household spending on the top four categories (nursing homes, doctor services, in-home health services, and drugs) will be $632 billion more than in 2015 (Figure 5).
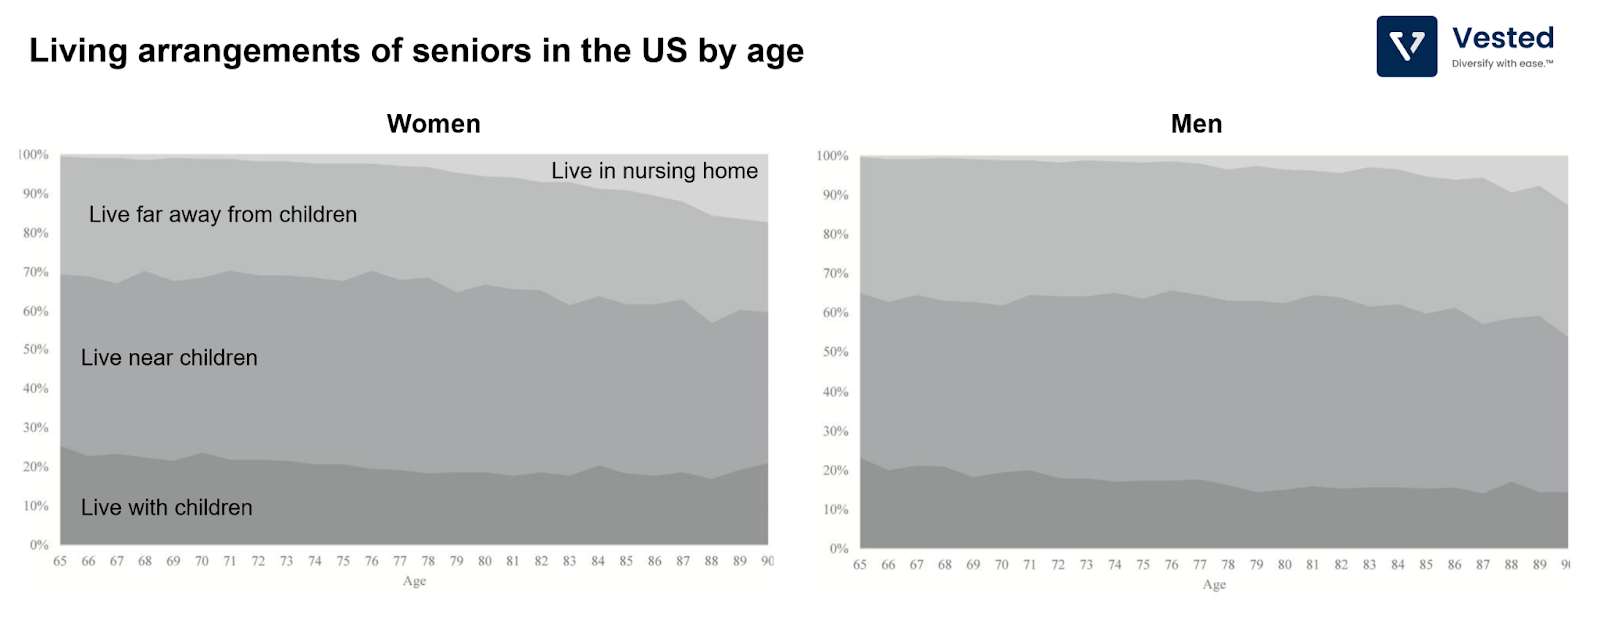
Home is where you get the most support
As people age, they require more care and, at some point, more support than their families can provide. By then, they may move to specialized facilities where they can receive more support, such as nursing homes, assisted living, and senior living communities. To see the evolution of this trend as a function of age, see Figure 5 below. Roughly 5 – 10% of people aged 80 eventually move to nursing homes.
The mega-trend of the aging population as an investment theme is not lost on investors. Almost 12% of all nursing homes in the US, 9% of assisted housing facilities, 6% of medical offices, and 3% of hospitals are owned or operated by REITs. REITs are companies that own, operate, or finance income-producing real estate, which generates cash flow, which, in turn, is returned to shareholders via dividends.
Medicine and Drugs
Longer life expectancy is typically accompanied by longer management of chronic illness. Unfortunately, quantity does not always come with quality – maintaining a good quality of life takes a lot of work.
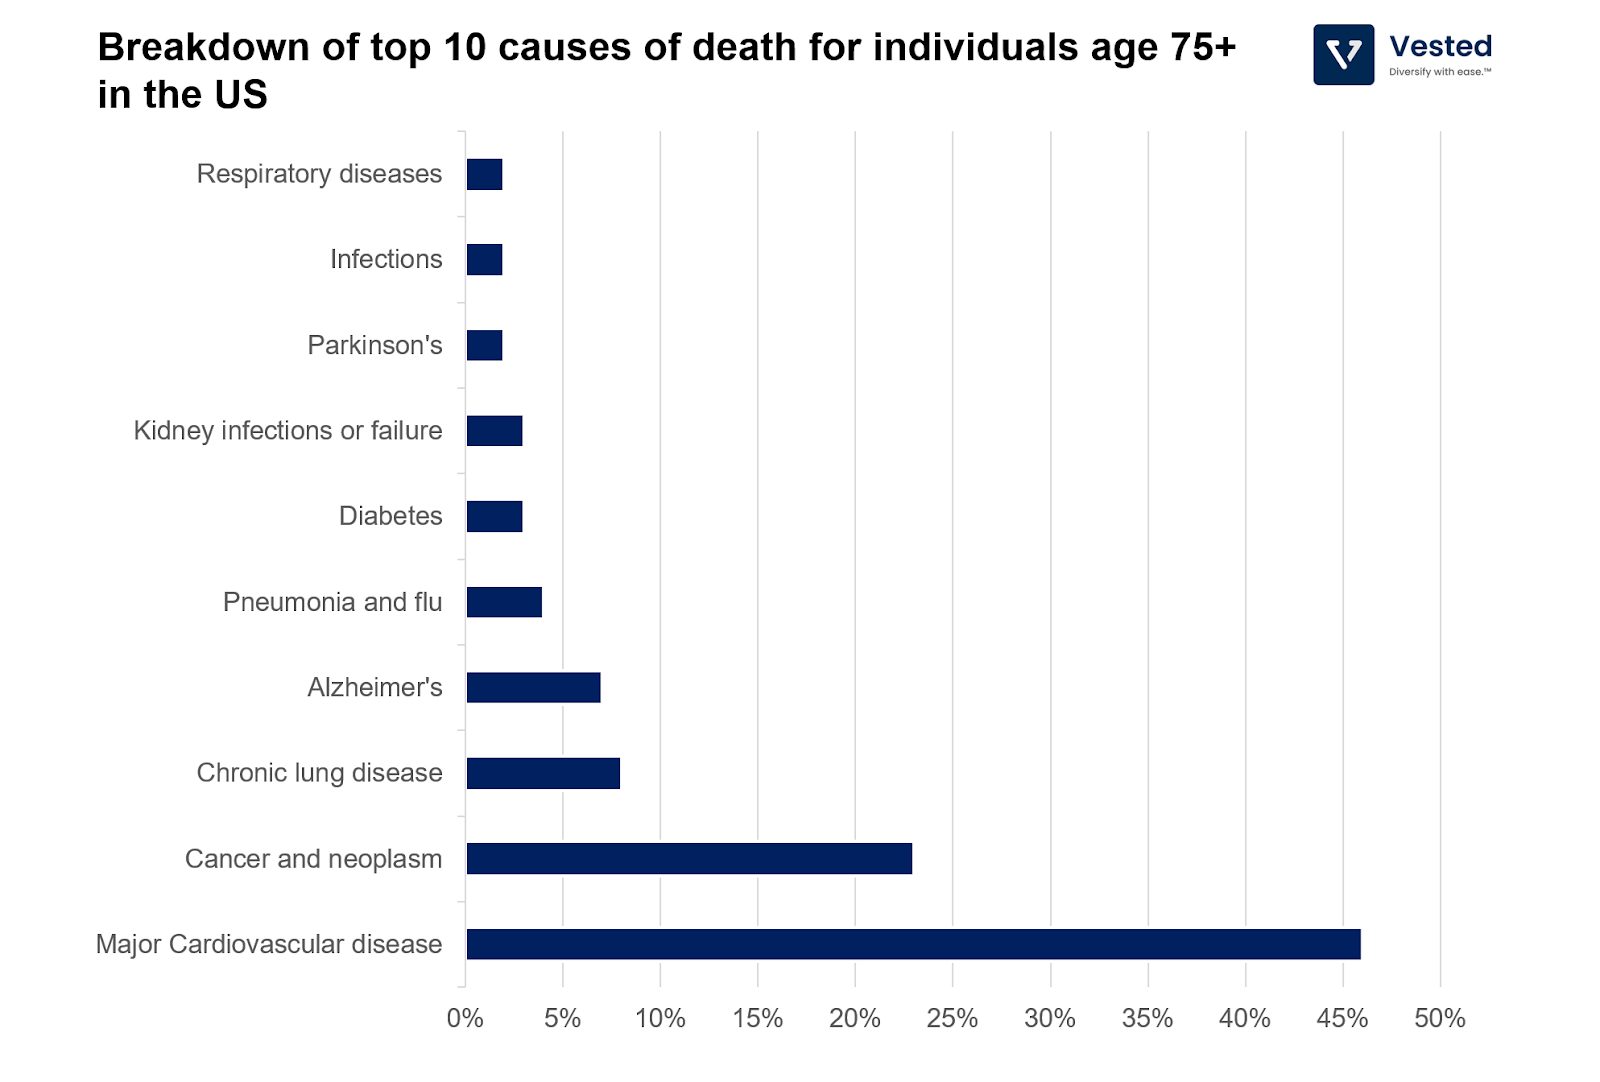
In the US, major cardiovascular disease is still the number one killer. In fact, almost 40% of people aged 65+ are considered obese, and more than two-thirds have high blood pressure (hypertension).
In this age group, the primary insurance provider is Medicare, the US government’s federal health insurance for people 65 or older. And because it’s a public entity, they publish the drugs they spend the most on. Commensurate with the top 10 causes of death shown above, the drug spend is focused on treatments for cancer and heart-related diseases.
The two drugs that Medicare spends the most on are Eliquis, a drug to prevent blood clots, and Revlimid, which treats cancer. Both drugs are made by Bristol Myers Squibb (BMY) and contribute to 51% of the company’s revenue.
An aging demographic needs more robots
Broadly, investments in automation can be for two main reasons: (i) to replace workers and reduce costs or (ii) to address labor shortages. For most countries that are facing a rapidly aging population, reason number two is the primary driver of adopting automation. Countries such as South Korea, Japan, and Germany are three primary examples of this.
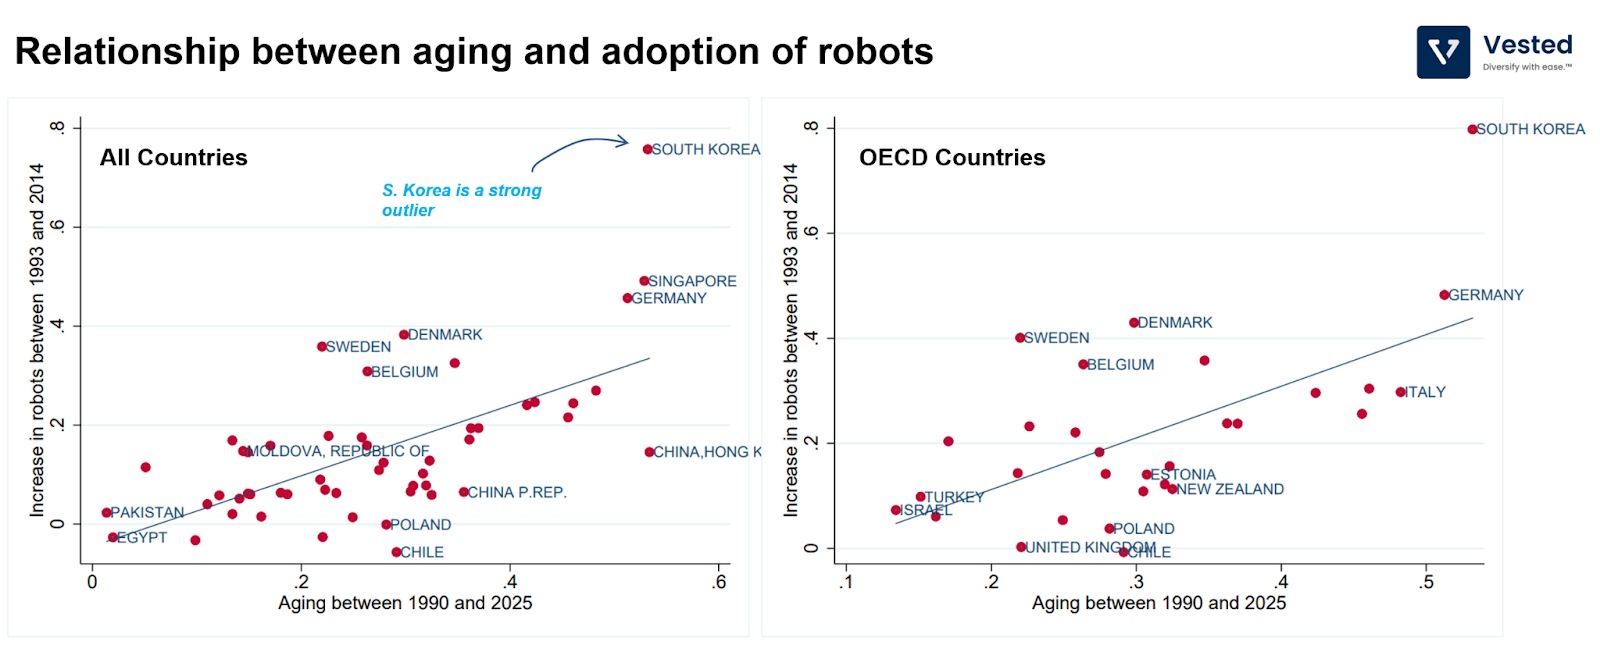
Notice in Figure 8 above how much of an outlier South Korea is. It is a country that is aging rapidly. It has the lowest fertility rate in the world, with just 0.79 children per woman, despite spending $200 billion in subsidies to promote child-rearing in the past 16 years. For most countries, however, researchers estimated that a 10% increase in the ratio of the number of middle-aged to older workers is associated with 0.9 more robots per thousand workers.
What it all means for investors
Taken together, expect to see a changing economy, not just in the US but also elsewhere. The Aging Vest is one strategy investors could use to potentially increase their exposure to the aforementioned themes:
- An aging demographic may lead to an increase in healthcare spending that broadly can be categorized into two categories: (i) Assisted/special living situation and (ii) healthcare needs that encompasses hospital & doctor services, and medication & drugs.
- Just like South Korea, Germany, and Japan, other aging countries must follow suit. To maintain levels of productivity, investments in the robot to augment the labor pool is necessary.
