

Invest in 10,000+ US Stocks and ETFs
* Offering through VF Securities, Inc. (member FINRA/SIPC)
 Skip to content
 Our US Stock Returns Calculator allows you to calculate your earnings as if you are already invested in the US Stocks
Total value
Invested amount
Est. returns
Total value
CAGR
If you had invested $ 0 in January 2021, it would be worth $ 0 by August 2023 with 0% CAGR
The US Stock Return Calculator is a tool designed for Indian investors to track how much their US stock investments could have earned during a specific period. It’s a simple way to see the possible returns on investments made in the past. The calculator designed by Vested stands out as the most sophisticated one available online for Indian users, providing insights factoring in forex changes for accuracy. It’s important to note that this tool does not predict what will happen in the future; it’s all about giving you a clear picture of what your investment might have looked like had you invested earlier.
Here’s how you can use Vested’s US Stock Return Calculator, step by step:
Remember, this calculator helps you understand your past investments’ performance, not predict future earnings.
The calculator uses financial formulas to calculate the total return and CAGR. It factors in the stock’s price changes, dividends (if any), and the time period of investment to give a comprehensive view of past investment performance.
To calculate investment returns, the US Stock Return Calculator breaks down the process into three components, depending on the investment amount, the duration of the investment, and the selected currency:
Appreciation in stock price: This component measures how much the value of the stock has increased or decreased. It is calculated by subtracting the purchase price of the stock from its selling price over the time you owned it.
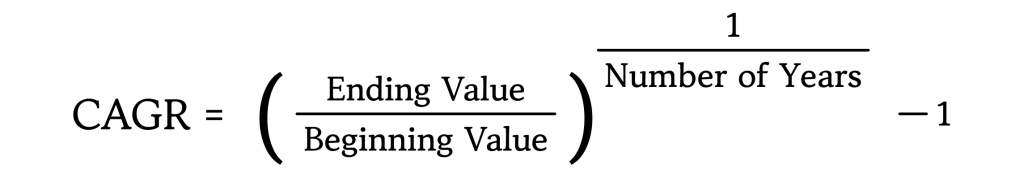
Compound annual growth rate (CAGR): CAGR is the rate at which an investment would have grown if it increased at a steady rate. CAGR uses the value of the investment at the beginning, its value at the end, and the investment’s duration in years. This gives the average annual growth rate (see Figure 1).
FX rate adjustment (Only if INR is Selected): If the investment is calculated in Indian Rupees (INR), the calculator adjusts the returns based on the foreign exchange rate between the INR and the US Dollar. This adjustment is crucial for Indian investors as it shows the actual return they would get after converting the USD returns to INR, accounting for any currency fluctuations over the investment period.
By combining these calculations, the calculator provides a detailed view of how much an investment has grown over a certain period, both in total return and as an annualized return through CAGR.
The FX rate, or foreign exchange rate, is crucial for Indian investors in US stocks. It reflects the value of the Indian rupee against the US dollar. A depreciating rupee means that the dollar investment grows not only from stock performance but also from the currency difference. This is factored into the calculator for accurate results.
Understanding the impact of the FX rate, or foreign exchange rate, is crucial for Indian investors in US stocks because it can significantly affect the actual returns they realize when converting dollars back into rupees.
Let’s take an example to understand this concept:
In October 2010, the S&P 500 was at 1,149 points, and by October 2023, it rose to 4,358 points. This is an absolute return of 280%, or an annualized return (CAGR) of 10.80%.
Meanwhile, India’s Nifty index went from 6,307 points to 19,411 points in the same period, which is an absolute return of 207% or a CAGR of 9.03%.
Now, consider the USD-INR exchange rate: In October 2010, 1 USD was equivalent to 45.24 INR. By October 2023, 1 USD equals 83.22 INR. This is a significant depreciation of the Indian Rupee against the US Dollar.
For an Indian investor, the gains from the S&P 500 would be further magnified when converted to INR due to the weakening rupee. Here’s a hypothetical scenario:
An Indian investor converts INR 45,240 INR to USD 1,000 in October 2010 (using the exchange rate of 45.24 INR per USD).
The investor uses this USD 1,000 to buy into the S&P 500.
In October 2023, the S&P 500 has gone up by 280%, so the investment is now worth USD 3,793.
To bring the money back to India, the investor converts the USD 3,793 at the new exchange rate of INR 83.22, receiving INR 315,642.
In INR terms, the initial investment of INR 45,240 has grown to INR 315,642, return of 597% (or CAGR of 16.12%), which is higher than the return would be if the investor had put the same amount in the Nifty index (207% or CAGR of 9.03%) . This is due to the combined effect of the S&P 500’s return and the USD-INR currency movement.
In summary, for Indian investors, not only the stock performance but also the USD-INR exchange rate plays a pivotal role in the total investment return when investing in US stocks (see Figure 2).

Vested’s US Stock Return Calculator presents several distinctive features that make it one of the most advanced calculators for calculating US stock returns.
Using the calculator has several advantages:
When using the US Stock Return Calculator, it’s important to know the assumptions and limitations:
In conclusion, the US Stock Return Calculator is a useful tool for Indians investing in US stocks. It offers a clear historical performance analysis and helps with investment planning. Remember, it’s about historical growth, not future projections. Use it wisely to complement your investment research for the future.
Yes, the calculator is designed for stock performance analysis, allowing you to compare the historical growth of various US stocks by selecting the stocks using multiple browser windows. This feature helps you make more informed decisions by looking at different stocks’ past returns.
While the results from the return calculator are based on real-time data and historical performance, remember these are fetched from our API partners. The results on the calculator provide a good indication of past returns but do not account for all variables, such as future market fluctuations or any company-specific changes.
No, the calculator does not compute taxes on stock returns. It provides a gross return estimate, not taking into account potential taxes or fees that may apply to your actual investment returns.
The US Stock Return Calculator isn’t set up to track the performance of US indices directly. Instead, it offers a feature to compare your chosen US stock or ETF against the S&P 500 index, which serves as a general benchmark for the US market. If you want to track the performance of other indices, you can do so indirectly by using Index ETFs that aim to mirror the performance of specific indices. However, keep in mind that when using ETFs for this purpose, there might be tracking errors, and factors like the expense ratio of the ETF can affect the accuracy of this comparison to some degree.
There are no charges for using the US Stock Return Calculator. It is offered as a free resource to help investors make informed decisions by understanding historical stock performance.
The stock return calculator takes into account the past market conditions within its analysis. However, it does not predict how current or future market conditions will impact stock performance. Investors should consider that market volatility and economic factors can significantly affect investment returns.
