A tale of two earnings: Tesla and Facebook
A tale of two earnings: Tesla and Facebook. One company delivered flat year-over-year revenue growth and is still unprofitable – just to have their share price soar post-earnings release. The other posted stronger than expected revenue – just to have their share price drop after earnings were announced.
It’s all about investor expectations.
Tesla’s strong year
Tesla reported its last quarterly earnings of 2019, capping a strong year. The company reported earnings per share of US $2.14, powered by US $7.4 billion in sales. This is above the expected earnings per share of US $1.77 (and US $7 billion in sales).
More cars but flat revenue
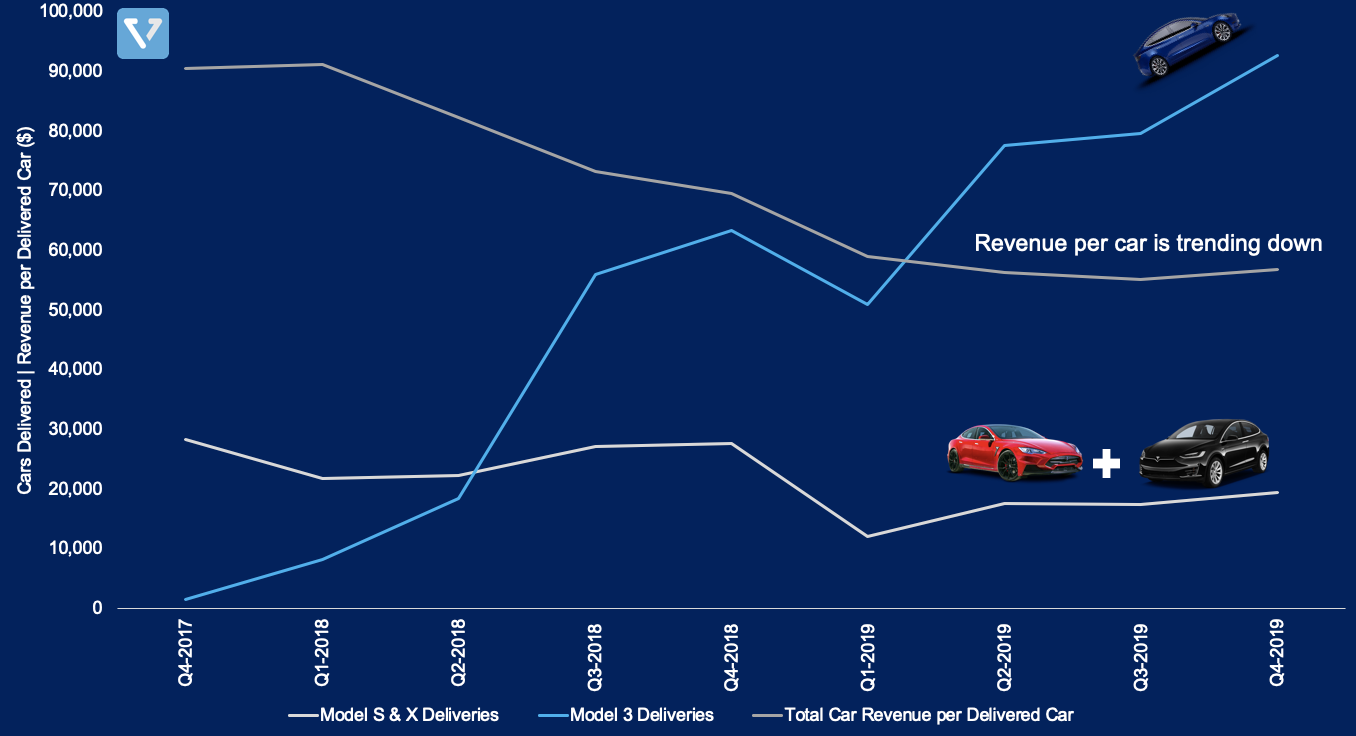
Car deliveries (an important metric for Tesla – see our deep dive) increased 23% from the same quarter the year before. This increase is due to sales of the Model 3. Despite the increase in deliveries, automotive revenue is largely flat (increased only by 0.7%), as although Tesla is selling more cars, the average selling prices of cars are declining because of two factors (see Figure 1): (1) the company is selling less of the more expensive Model S & Model X; and (2) the introduction of a cheaper version of Model 3. This is to be expected however: As Tesla’s cars are becoming more mainstream, the average revenue per car goes down.

Looking Ahead
Four things to look out for in 2020:
- Tesla will launch the Model Y (compact electric SUV) beginning in Q2 2020. The Model Y is built on the same platform as Model 3, therefore the ramp up speed should be higher and the cost of tooling should be lower than the initial Model 3 launch (which was very problematic for the company). This launch is significant for continued growth of the company, since the popularity of compact SUV in China and US exceeds that of the premium sedan (the Model 3 is a sedan). One in four cars sold in the US is a compact SUV.
- Cash is king. Tesla expects the business to be self-sustaining from now on (with the possible temporary exceptions around the launch and ramp-up of new products). At the end of 2019, the company reported US $6.3 billion in cash and cash equivalents (thanks to strong car sales in this past quarter that gave it an extra US $1 billion in free cash flow). To continue generating sufficient cash flow, the company must continue to execute well by ramping up production and deliveries of its vehicle.
- Software-as-a-Service. In order to extract more revenue per user, Tesla launched Premium Connectivity (in-car live connectivity) in the US for US $9.99 per month. The company also allows its customers to buy software updates for the car (Autopilot, acceleration boost, etc). This strategy of selling premium hardware and extracting more revenue from users by selling additional software services is similar to Apple’s strategy.
- The threat of the coronavirus. Tesla is relying on its new Gigafactory in Shanghai to meet the demands of its Model 3. Any supply chain disruption the company may experience due to the epidemic will hamper its ability to deliver cars, which can negatively impact its cash flow and may result in a significant drop of the share price.
Investing in Tesla remains a risky proposition, especially after the run up in the past few days. There’s a possibility that we are seeing the beginning of a Tesla bubble.
At first glance, it seems that Facebook closed the year strong, with strong user-base and top line revenue growth. But yet, the stock dropped after the earnings report was released.
The good news
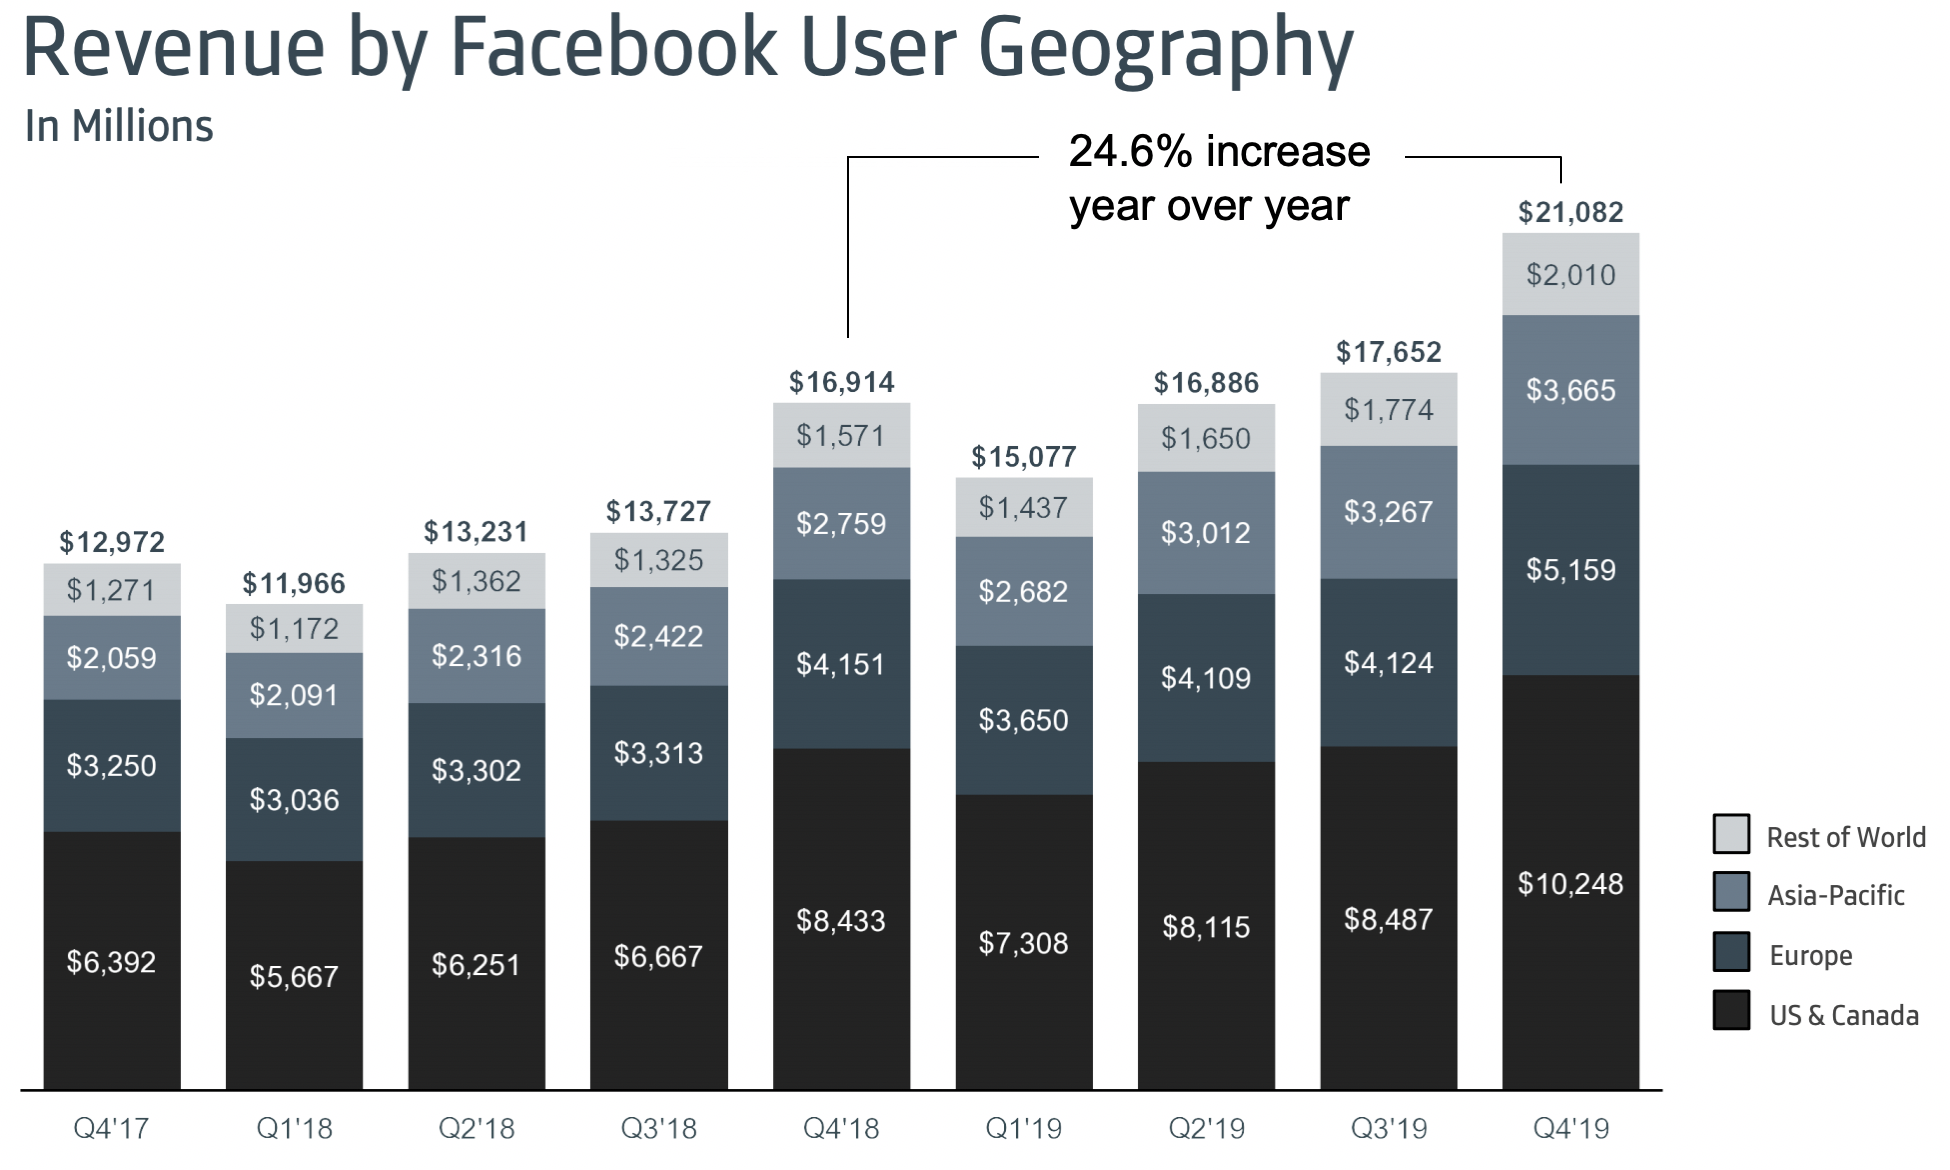
- Top line growth beat expectations. Facebook’s Q4 2019 delivered US $21.08 billion in revenue (beating the expected US $20.89 billion).
- User base continues to grow. Facebook grew to 2.5 billion average monthly active users (MAUs), a 7.6% increase compared to the same quarter in 2018 (that’s 55% of the world’s internet population!). The fastest growing region is Asia Pacific, which grew 9.6%. Nonetheless, in the short term, user growth in US & Canada is the most important, since this region has the largest impact on the top line. At the end of Q4 2019, Facebook added another 5 million users from this region compared to the same period in 2018.
- Global average revenue per user (ARPU) continues to increase. In the US and Canada, ARPU increased 18.8% to US $41.41 per user. While in Asia Pacific, ARPU went up from US $2.96 to $3.57. Users in the US and Canada generate 11X more revenue than users in Asia Pacific.

Despite beating expectations, however, the share price fell, as the company is facing headwinds.
The Headwinds
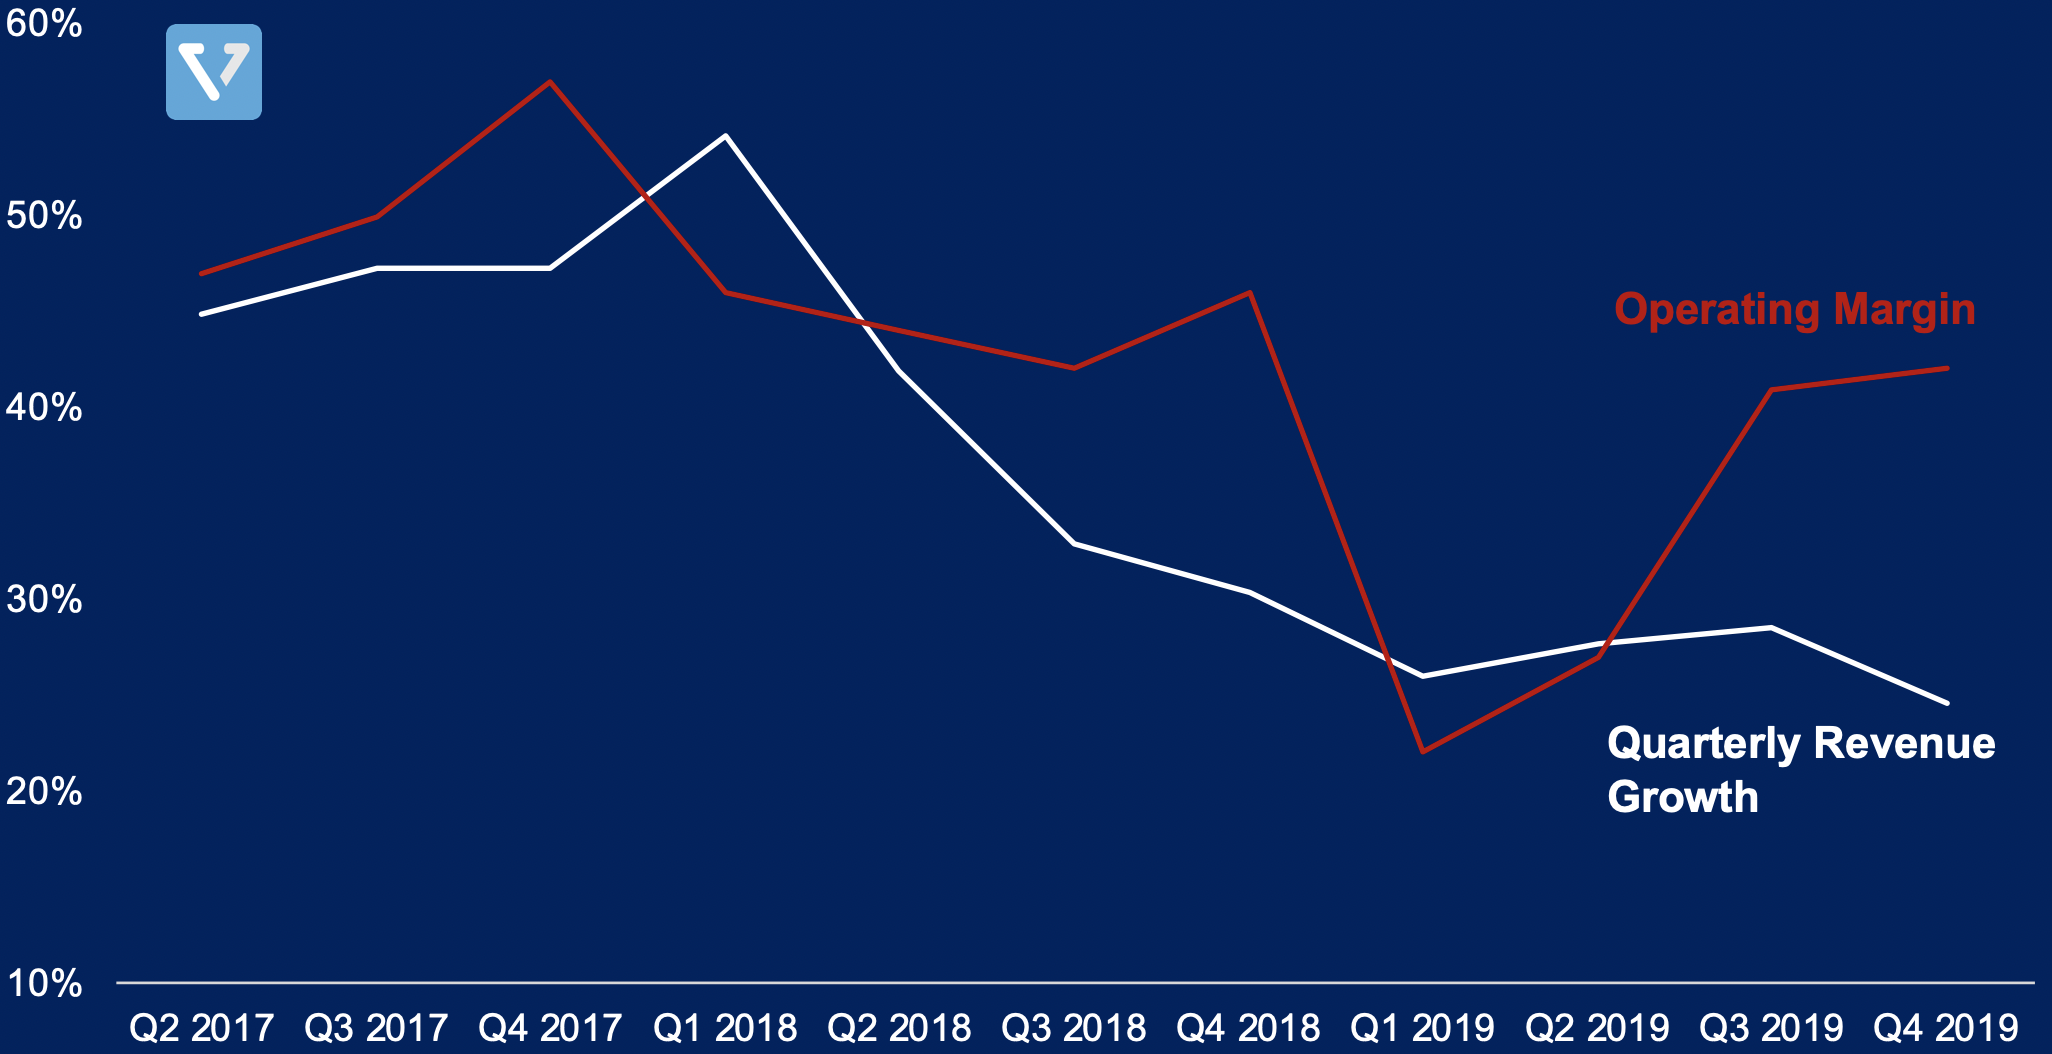
- Investors are concerned about slowing revenue growth. Facebook’s revenue growth has been under 30% in the past four quarters.
- Operating margin has also been in decline. This is due to the company’s continued investments in security. This trend is expected to continue in 2020, as the company expects to spend around US $54 billion – $59 billion in 2020 (a 15% – 21% increase over 2019).

- New policies like Europe’s GDPR and the US’ CCPA regulates what data can be used for advertising. These new policies may have negative effects of Facebook’s ability to target its users with advertising, reducing efficacy of its ads.
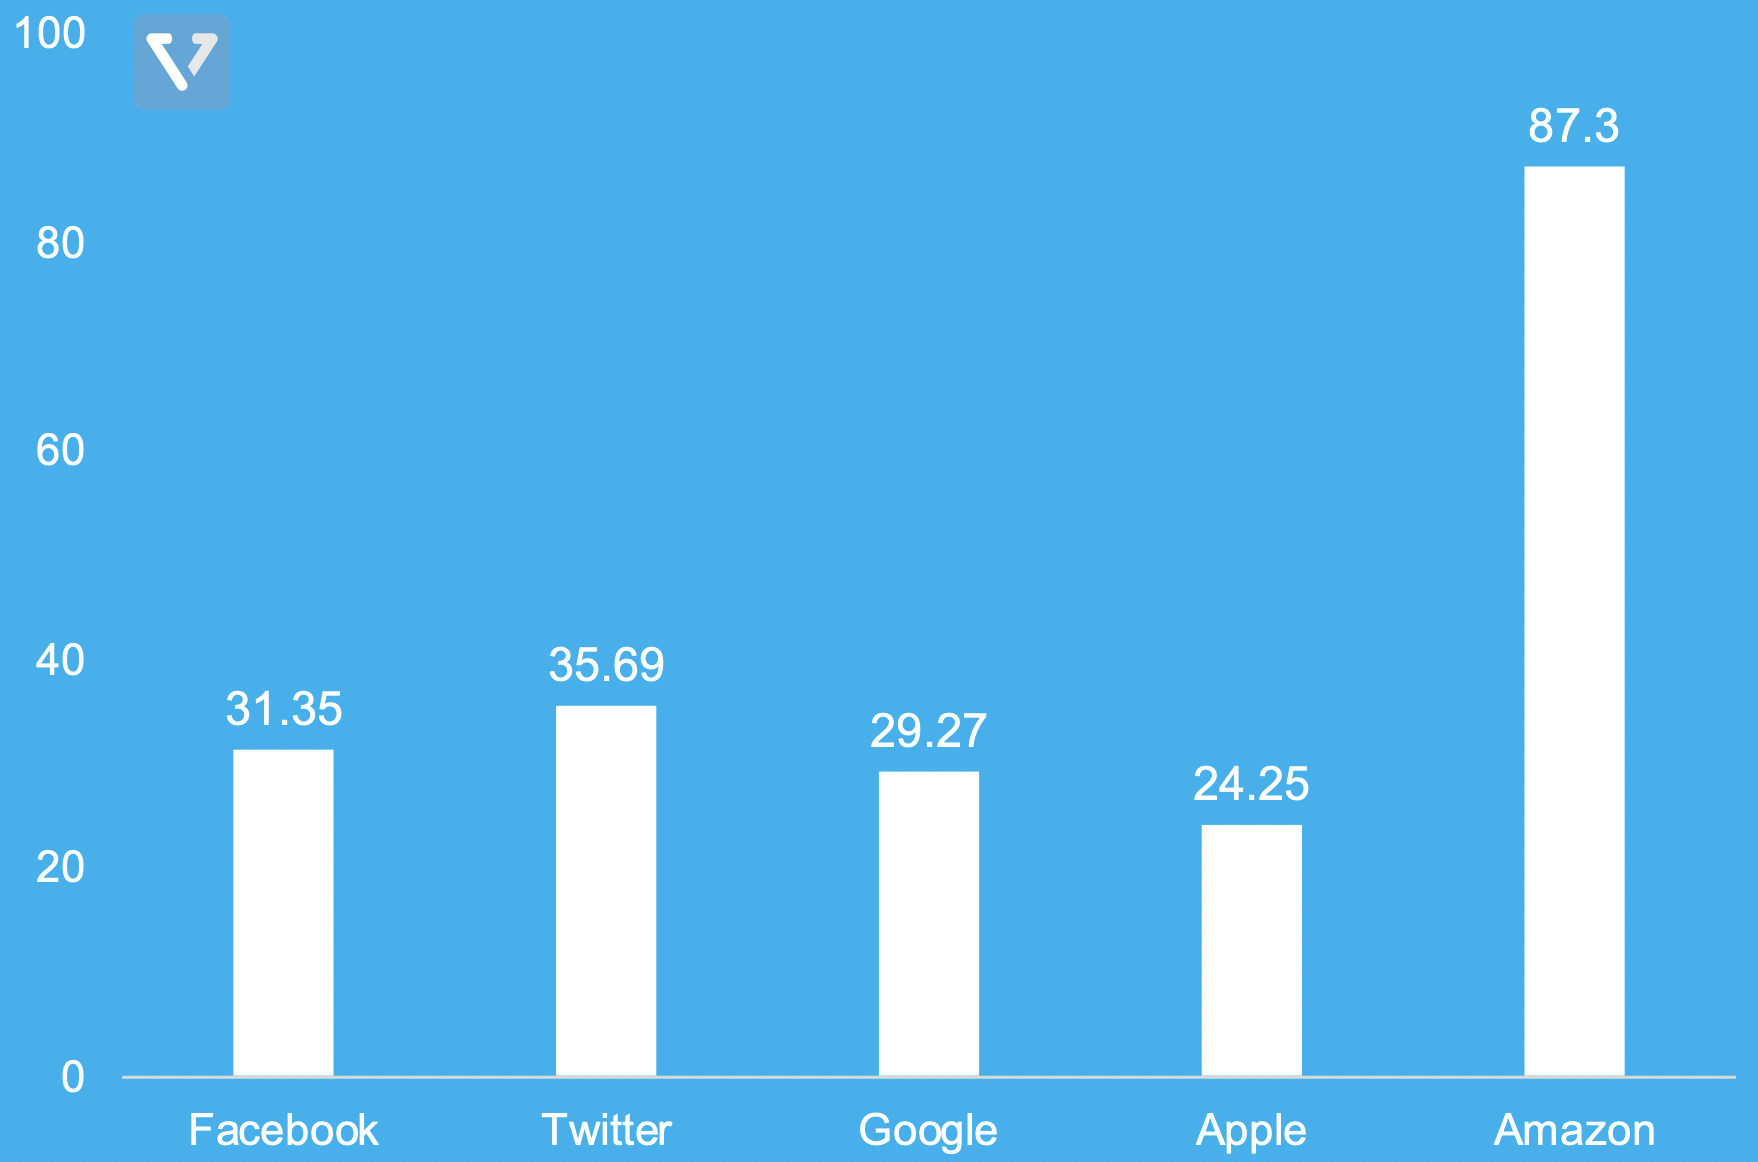
All in all, the earnings data seems to indicate that Facebook’s business continues to be solid and is consistent with its previous guidance. The drop in share price may be due to investors adjusting their expectations of the company. See Figure 4 for P/E ratio based on trailing twelve months earnings (TTM). After the share price decline – Facebook is valued between Google and Twitter, two digital advertising companies.

Thanks for reading – until next time!


