In this week’s article we take a tour of various metrics investors can use to assess different companies across different verticals. We will discuss:
- Cash conversion cycle (for retailers)
- Cash surplus/deficits after paying back shareholders (to asses oil companies)
- Customer acquisition cost (for subscription services)
Everyone knows that the retail business is highly competitive and has low gross margins. As such, getting efficiency out of your cash flow is very important. Retailers want to minimize the amount of capital tied to holding inventory.
One metric that is useful in measuring a retailers’ cash flow efficiency is the cash conversion cycle (CCC). This is the number of days between when retailers have to pay their suppliers and when they get paid by their customers. The lower the number, the better, as it indicates that the company is more efficient in converting working capital into cash.
CCC is calculated as follows (Figure 1):

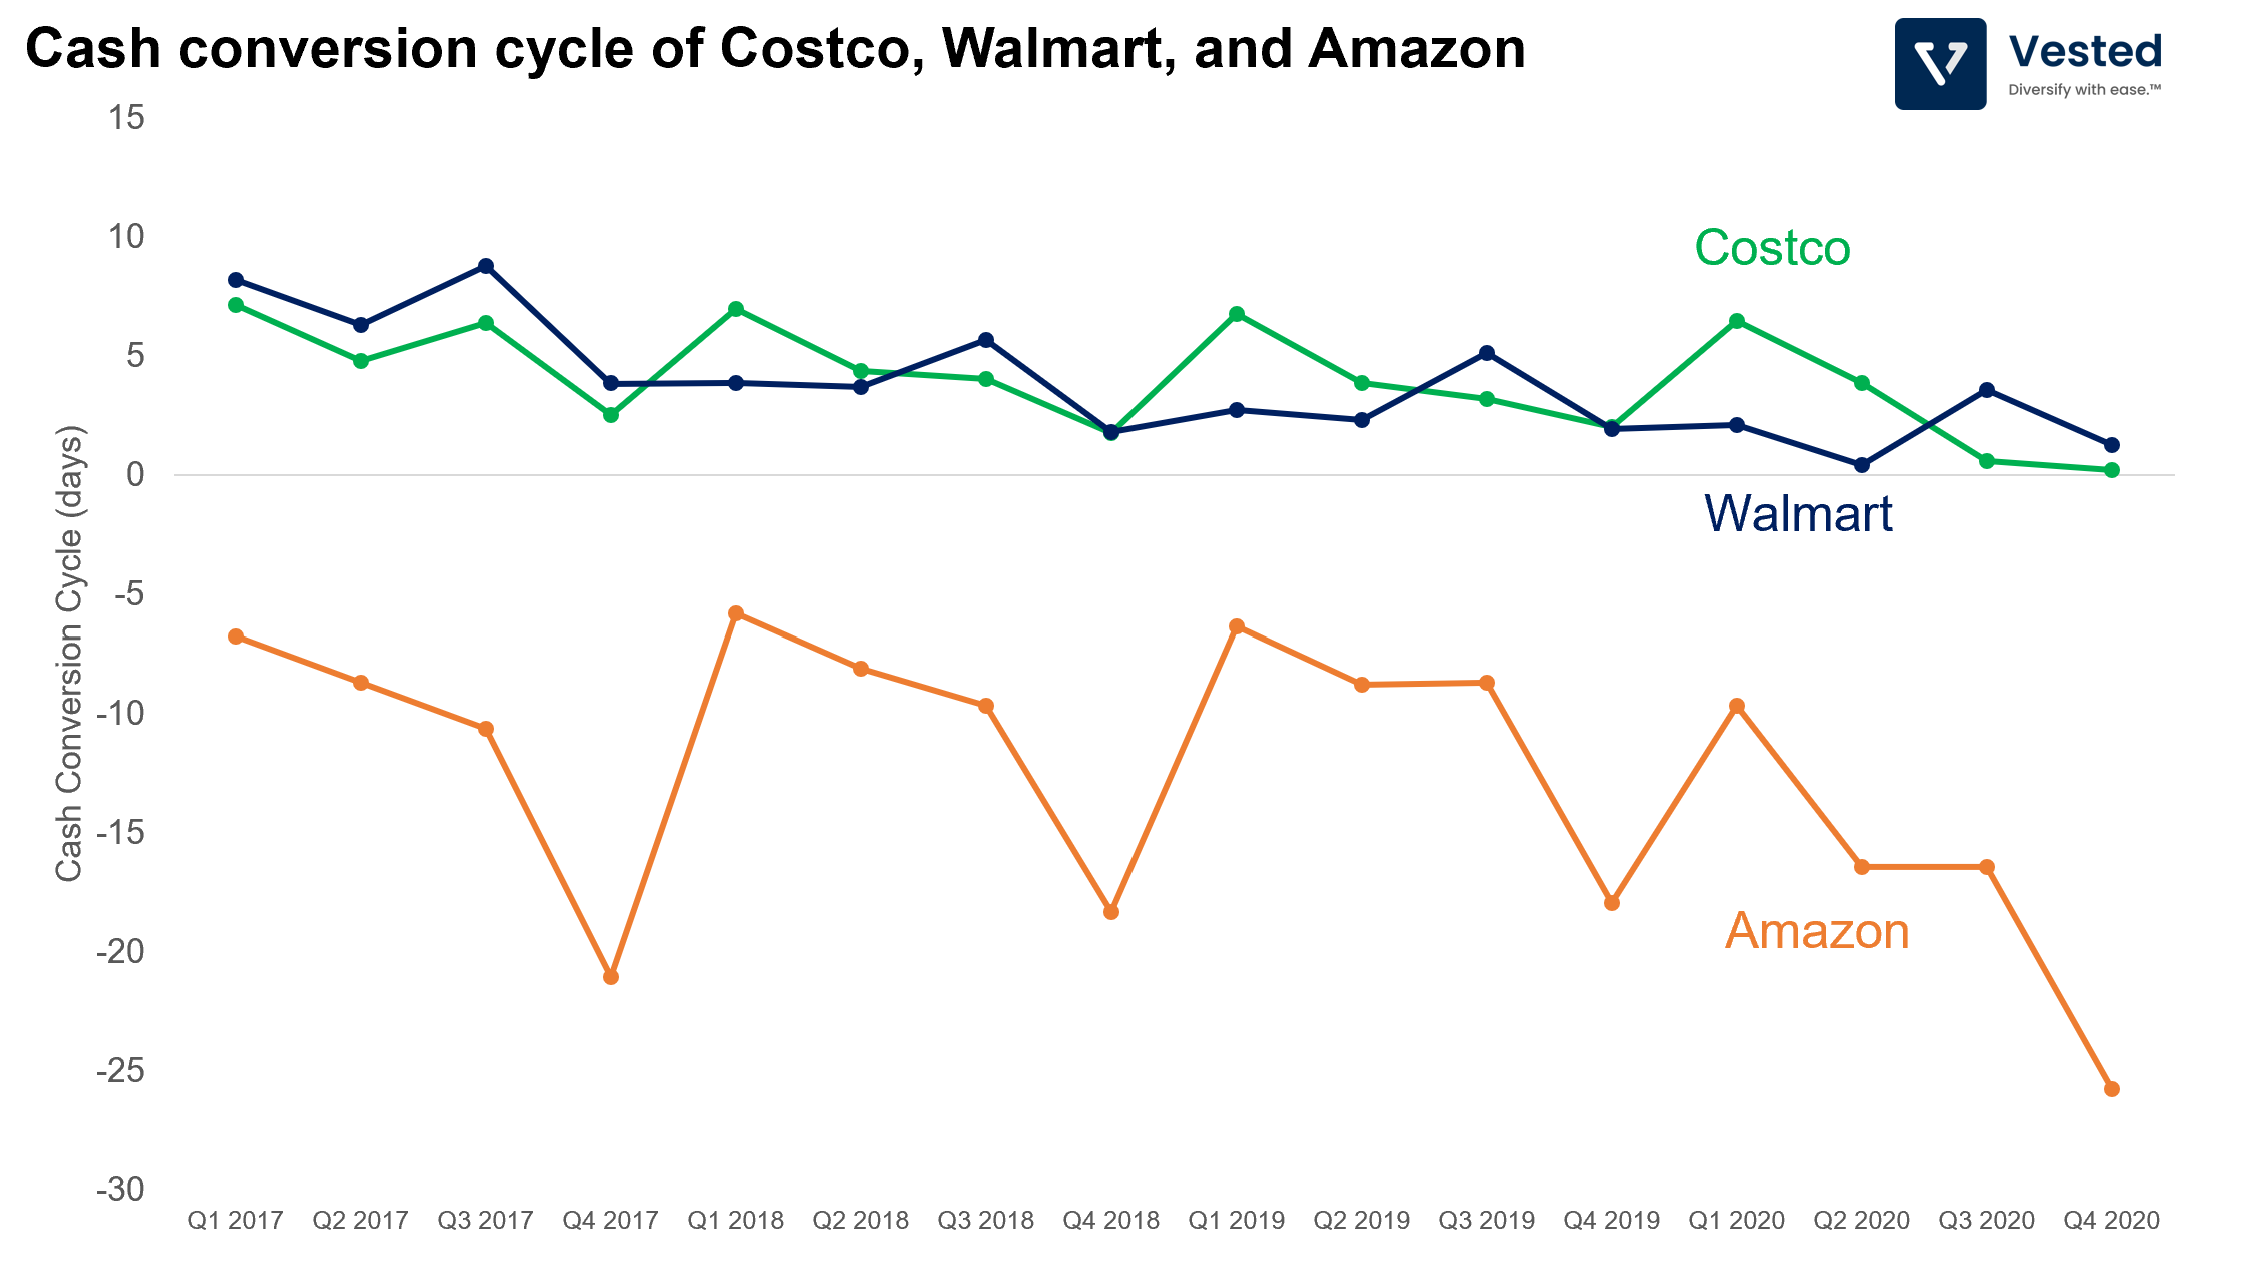
Figure 2 below shows the CCC comparison for the top three best-in-class retailers (Walmart, Costco and Amazon):
- Walmart (blue line) is well known for its efficiency and scale. The company is also known as a tough negotiator against its vendors. The constant drive for efficiency enables Walmart to achieve a CCC of less than two days (a significantly more efficient number than Macy’s average of 83 days in 2020).
- Costco (green line) is another best-in-class, members-only big box retailer. It is a beloved brand (so much so that despite having only one store in the whole of Iceland, 71% of the country’s population is a member). Costco offers a limited selection of items in its stores and therefore is an important partner for many of its vendors, which allow them to not only be very efficient in inventory management (Costco uses its warehouse as the store) but also extract favorable payment terms. As such, its average CCC in 2020 was 2.8 days.
- Amazon (orange line), even when compared to Walmart and Costco, is in a class of its own. Its CCC is negative ( average of -17 days in 2020)! This means that, on average, Amazon took in cash from its customers a full 17 days before it paid out its suppliers. This has a very powerful effect on the efficiency of Amazon’s business.
Cash surplus/deficit of oil companies
It is no secret that the oil industry has struggled in the past year. But even before COVID happened, the sector struggled for the better part of the decade since oil prices stumbled in 2014.
And now, faced with even more difficult macro headwinds (the projected slower growth in oil demand and the renewed drive to transition to a green energy economy), and after decades of denying global climate change, it may be too late for these oil companies to transition to become energy companies.
Despite knowing that these companies face a relatively grim future prospect, many investors still hold their shares because of their high dividends. At the moment, Exxon gives about 6.1% dividend yield (this means if you own US$100 worth of Exxon shares, you get US$6.1 in dividends). Many pension funds and investors rely on these dividends as a source of cash flow.
This is why despite struggles in their businesses, the four major oil companies (Exxon, Shell, Chevron, BP) are bending over backwards to maintain their dividend levels.
In a healthy company, you generate excess cash flow from your business to generate returns for shareholders,. This can be done in two ways:
- Give cash back in the form of dividends.
- Use your excess cash to buyback shares, which in turn increases the price per share.
In other words, the equation looks like this (Figure 3):
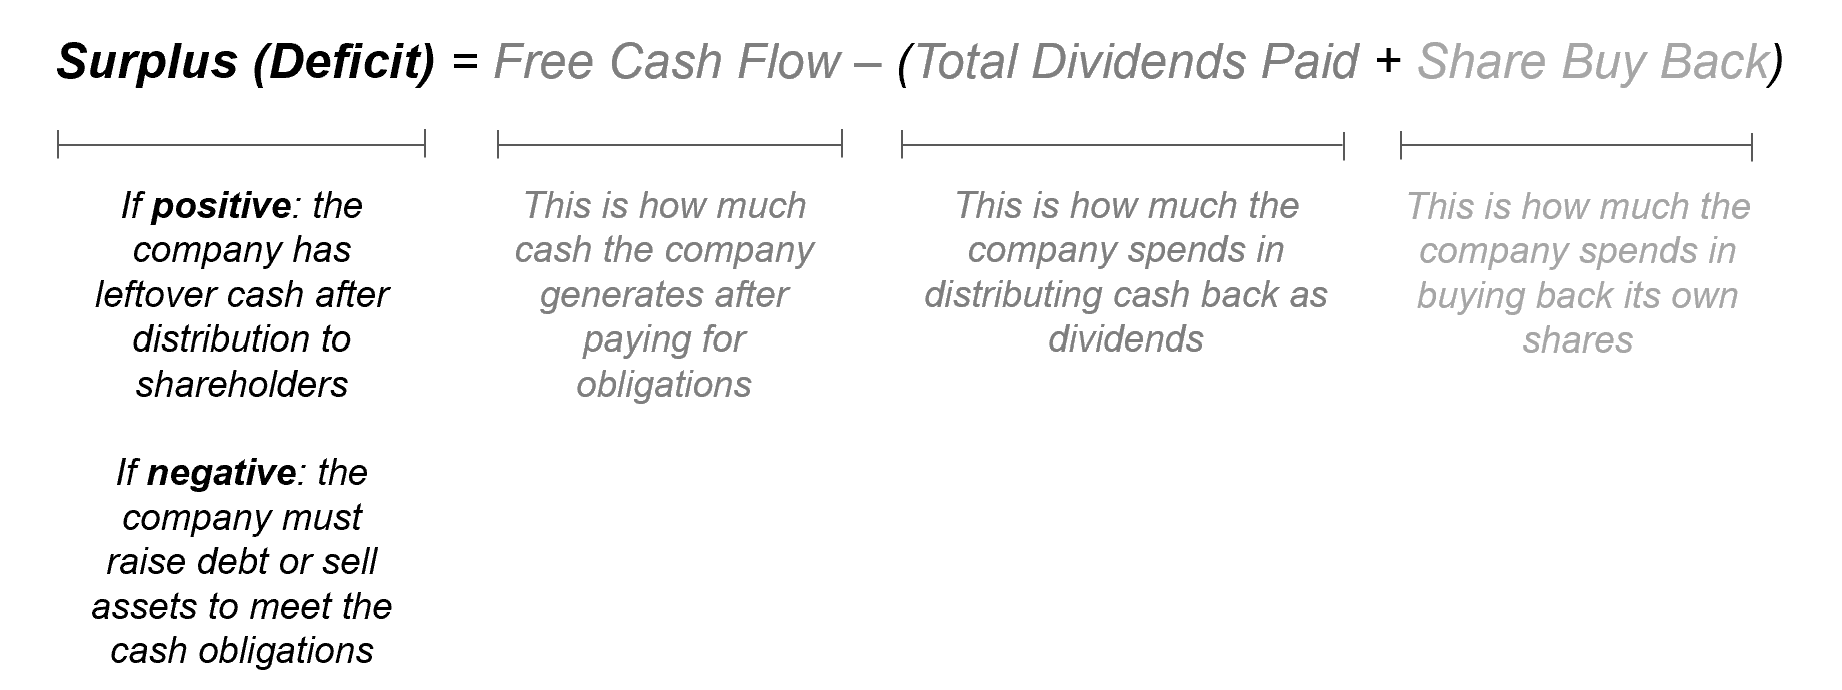
- Free cash flow: The amount of cash that a company generates from operating its business, after paying for immediate obligations.
- Total dividends paid: The amount of cash that the company returns to shareholders as dividends.
- Share buy back: The amount of cash that the company uses to buy back its own shares. Buying back shares has the effect of increasing price per share since there are less shares in circulation. Conversely, companies can also issue new shares (and therefore, raise cash).
Note: If you’re using our web platform, you can find these values within the stock details page, under Fundamental Data / Cash Flow.
- If the company generates more free cash flow than it needs to pay dividends and share buyback, then it has a surplus (the amount is positive).
- If the company does not have enough cash to pay dividends and share buyback, then it has a deficit (the amount is negative).
See Figure 4 for the cash surplus/deficit trends for the big four oil companies from the past 5 years.
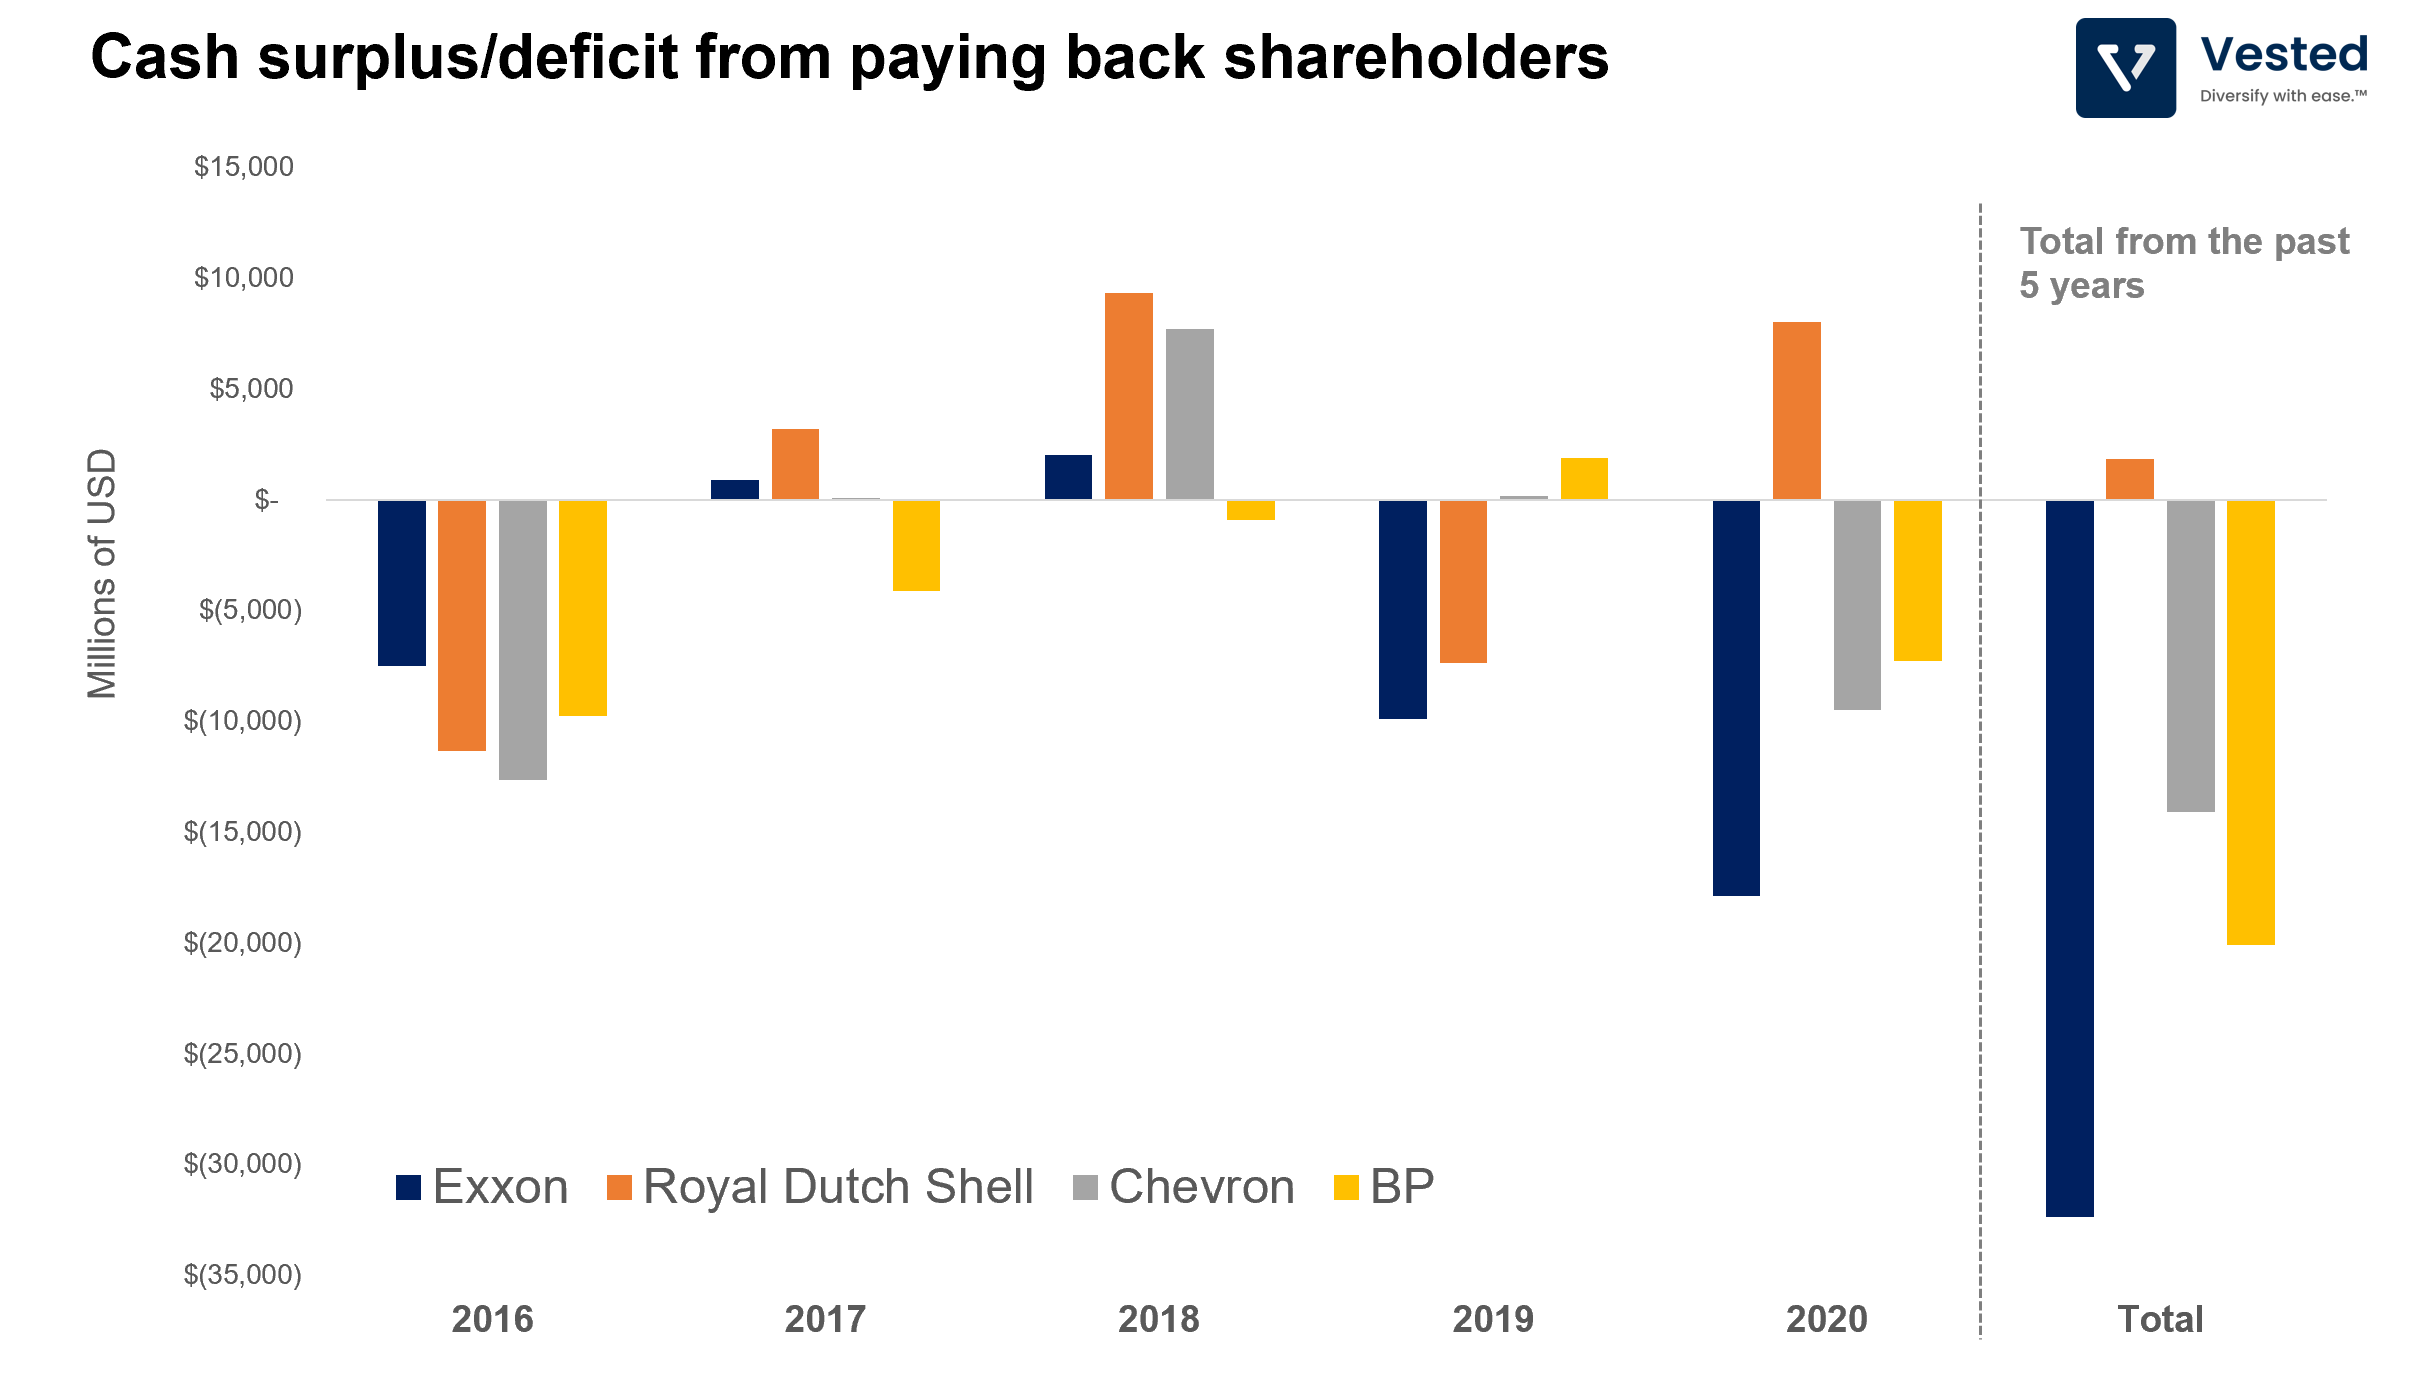
- Generally, these companies go into the deficit quite often!
- Of the four companies, only Shell (orange bar) is able to have a surplus over the span of five years (US$ 1.8 billion).
- Exxon (dark blue bar) is a most egregious offender. The company is trying so hard to maintain its ~6% dividend that it has amassed a deficit of US$32.3 billion over the last five years.
In 2020, Exxon generated negative US$2.6 billion in free cash flow, yet the company still spent US$14.8 billion in dividends and US$405 million in share buyback….
Surely you cannot run a deficit forever? Well – these companies have been doing this for a better part of the last decade. They cover the deficit in cash flow by raising debt and selling down assets. Surely this is not a sustainable strategy, as:
- Higher debt means higher debt interest payments and obligations (which consume cash).
- Selling down assets means reduction of growth.
- In an environment where many oil companies are trying to sell assets – asset prices will decline.
Why don’t they just stop dividends? The challenge for these companies is that if they interrupt or reduce their dividend payments, their share price will decline, which may make it difficult for them to raise new debt. This could result in these companies entering a downward spiral.
Customer Acquisition Cost (CAC) for subscription services
Some of the best businesses in the world employ subscription business models, as it provides more stable predictable revenue. But one mistake that investors and business operators often make is to assume that the cost of acquiring customers (CAC) will stay the same or decrease over time. They then extrapolate the low CAC to a much larger total addressable market (TAM), leading to over-expansion and failure of the business.
In reality, however, CAC tends to increase over time. Early in the business cycle, the company can acquire early adopters at a much lower cost. But as it grows beyond its initial niche, it has to capture and convert customers with lower levels of interests (Figure 5).
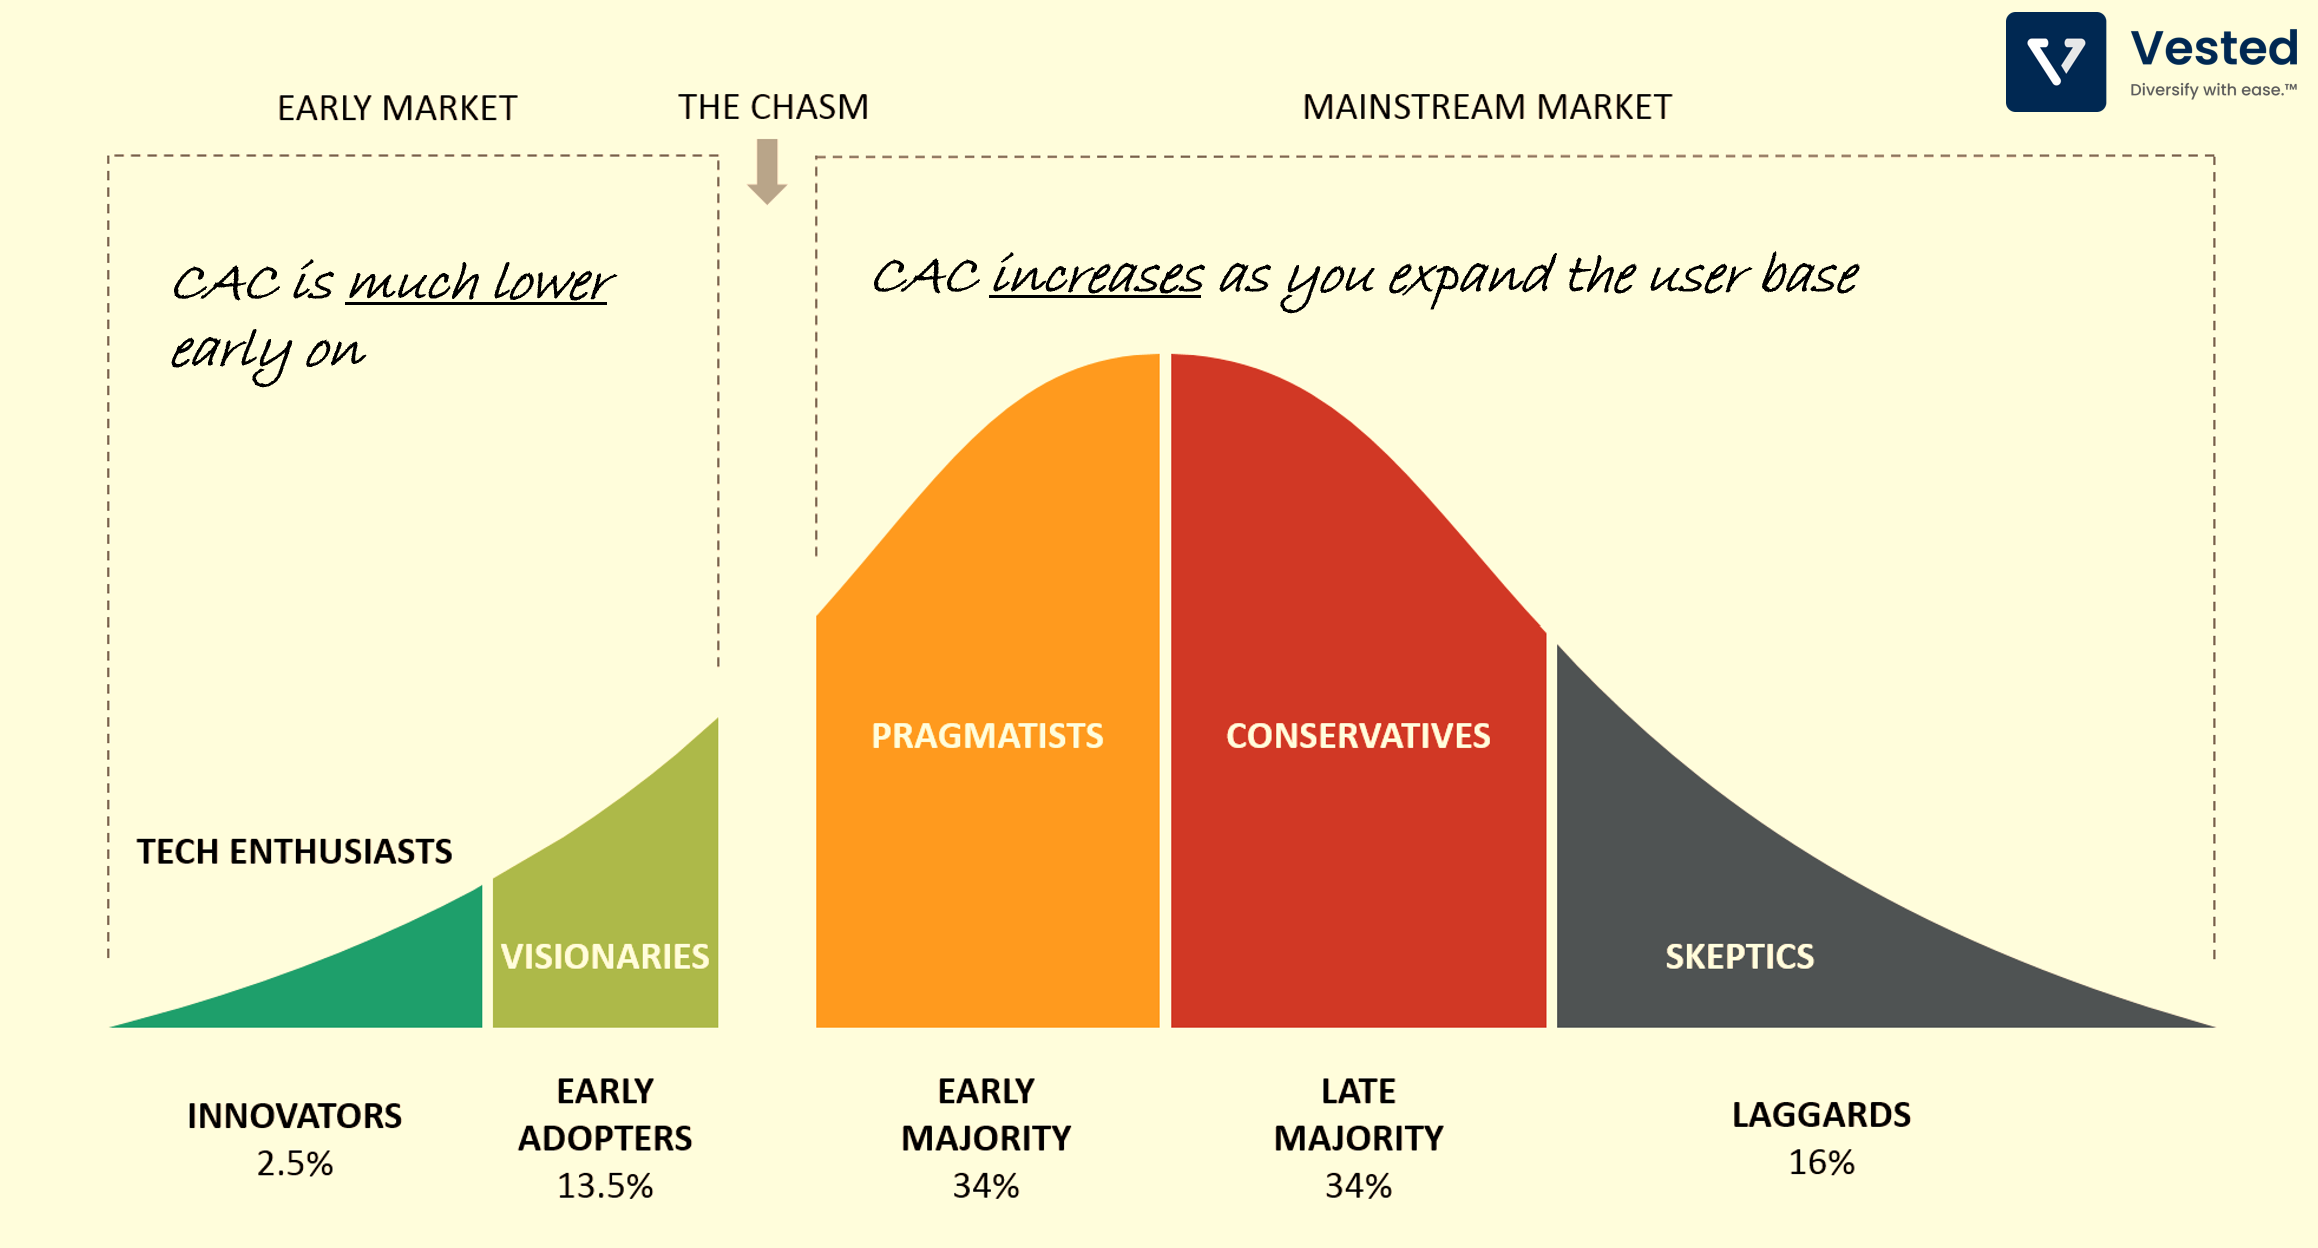
What does this mean when you’re evaluating subscription businesses? You need to estimate CAC to see if it’s increasing, decreasing or staying flat, as the company’s ability to grow is predicated on being able to grow while maintaining stable CAC.
An example of unstable CAC: Blue Apron
Blue Apron is a meal kit subscription service. The company sends its members boxes with prepared ingredients that make cooking a meal easier.
As you can see from the share price history of Blue Apron (Figure 6), the share price never traded higher than its public debut price (this is why investing upon IPO may not be the best idea – but that is a discussion for another day).
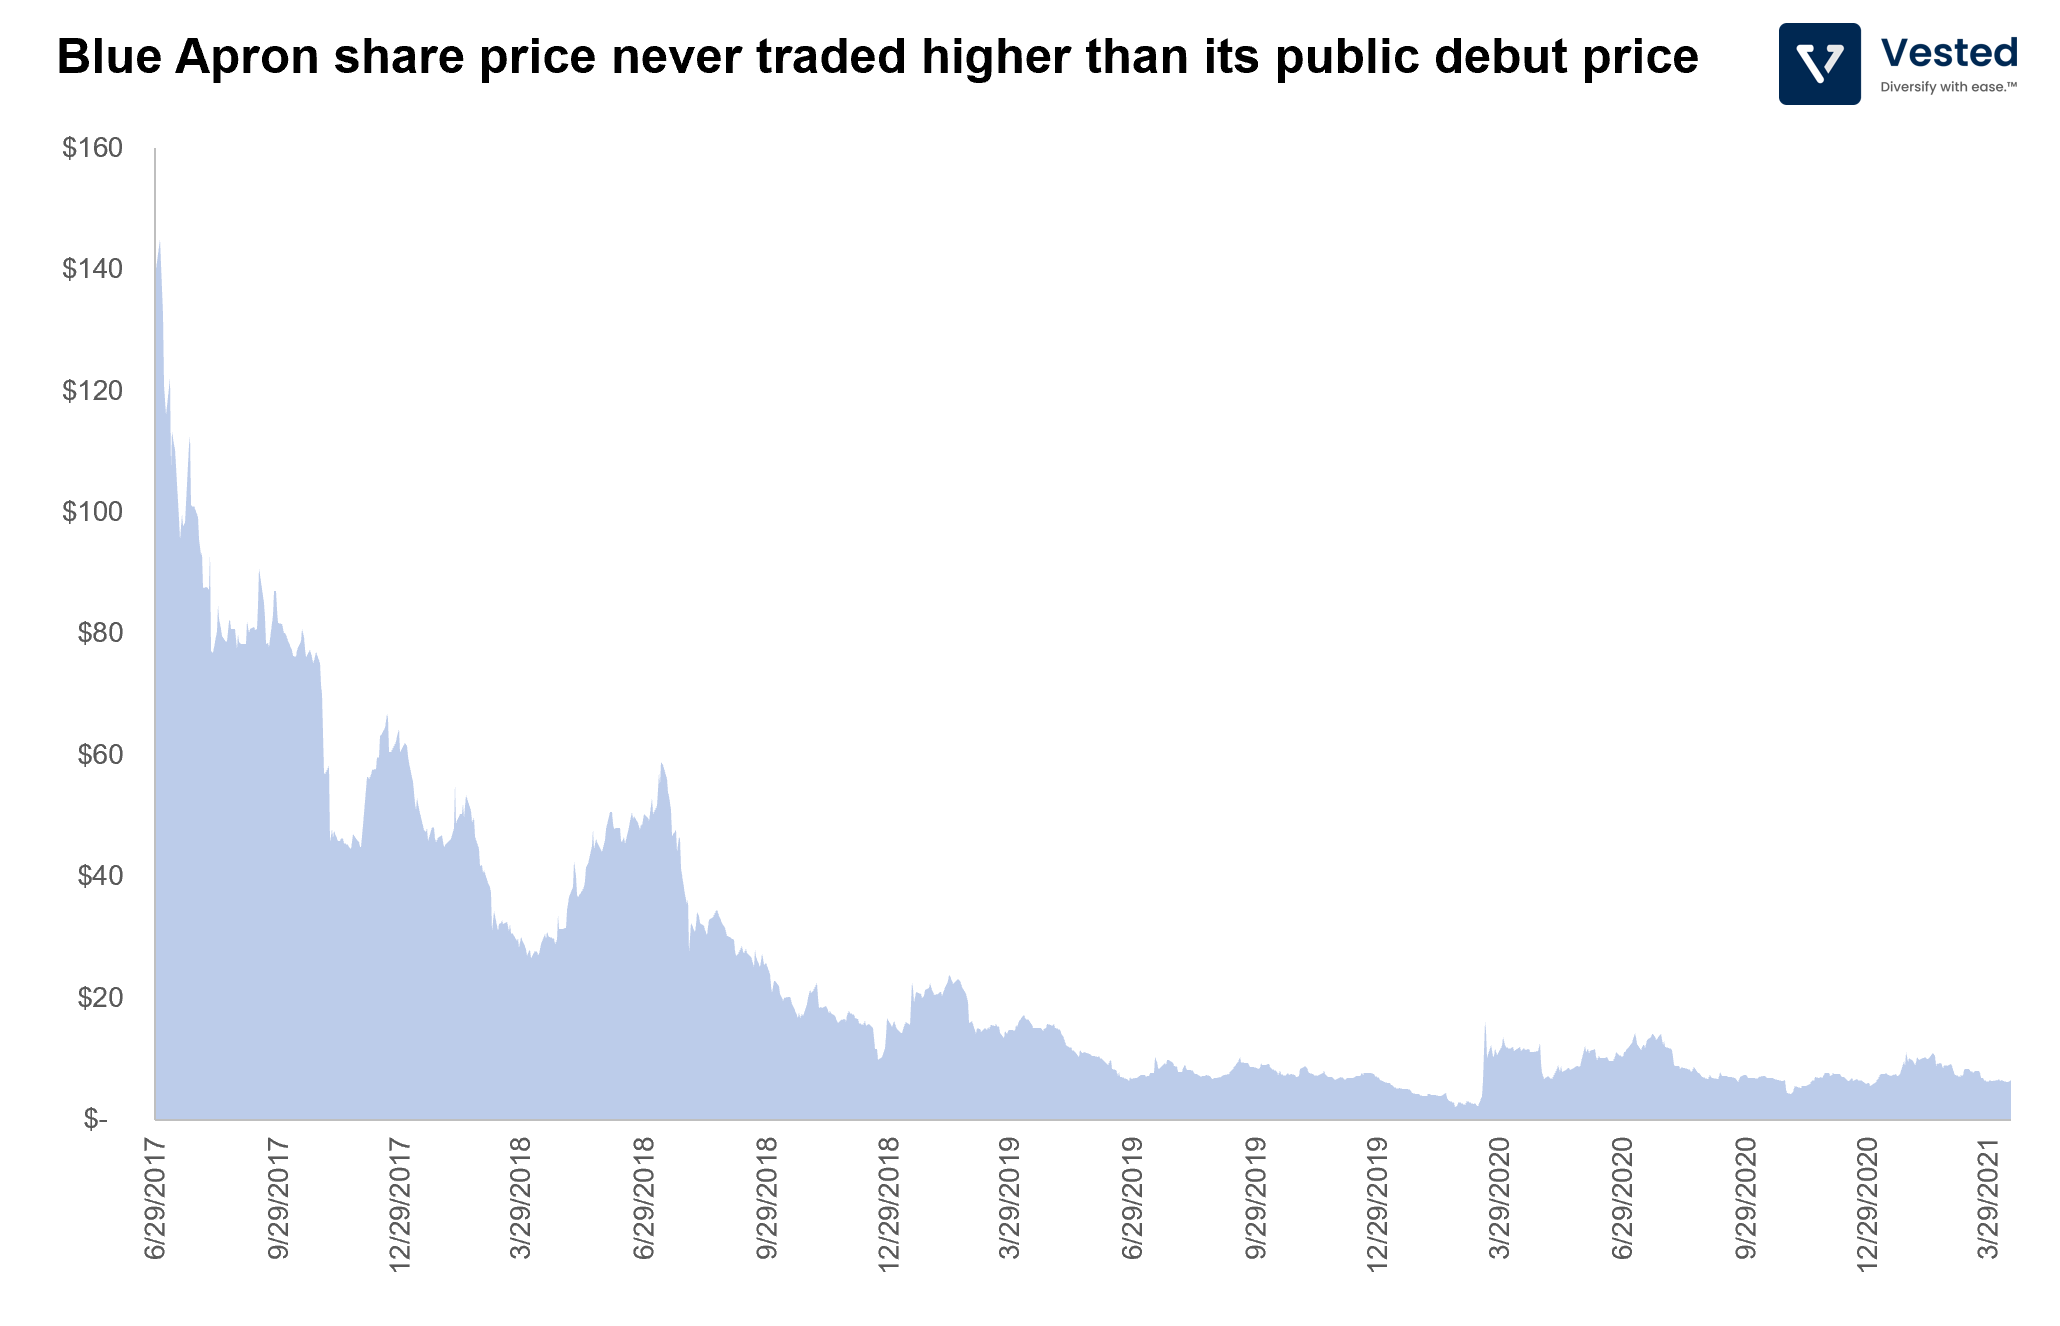
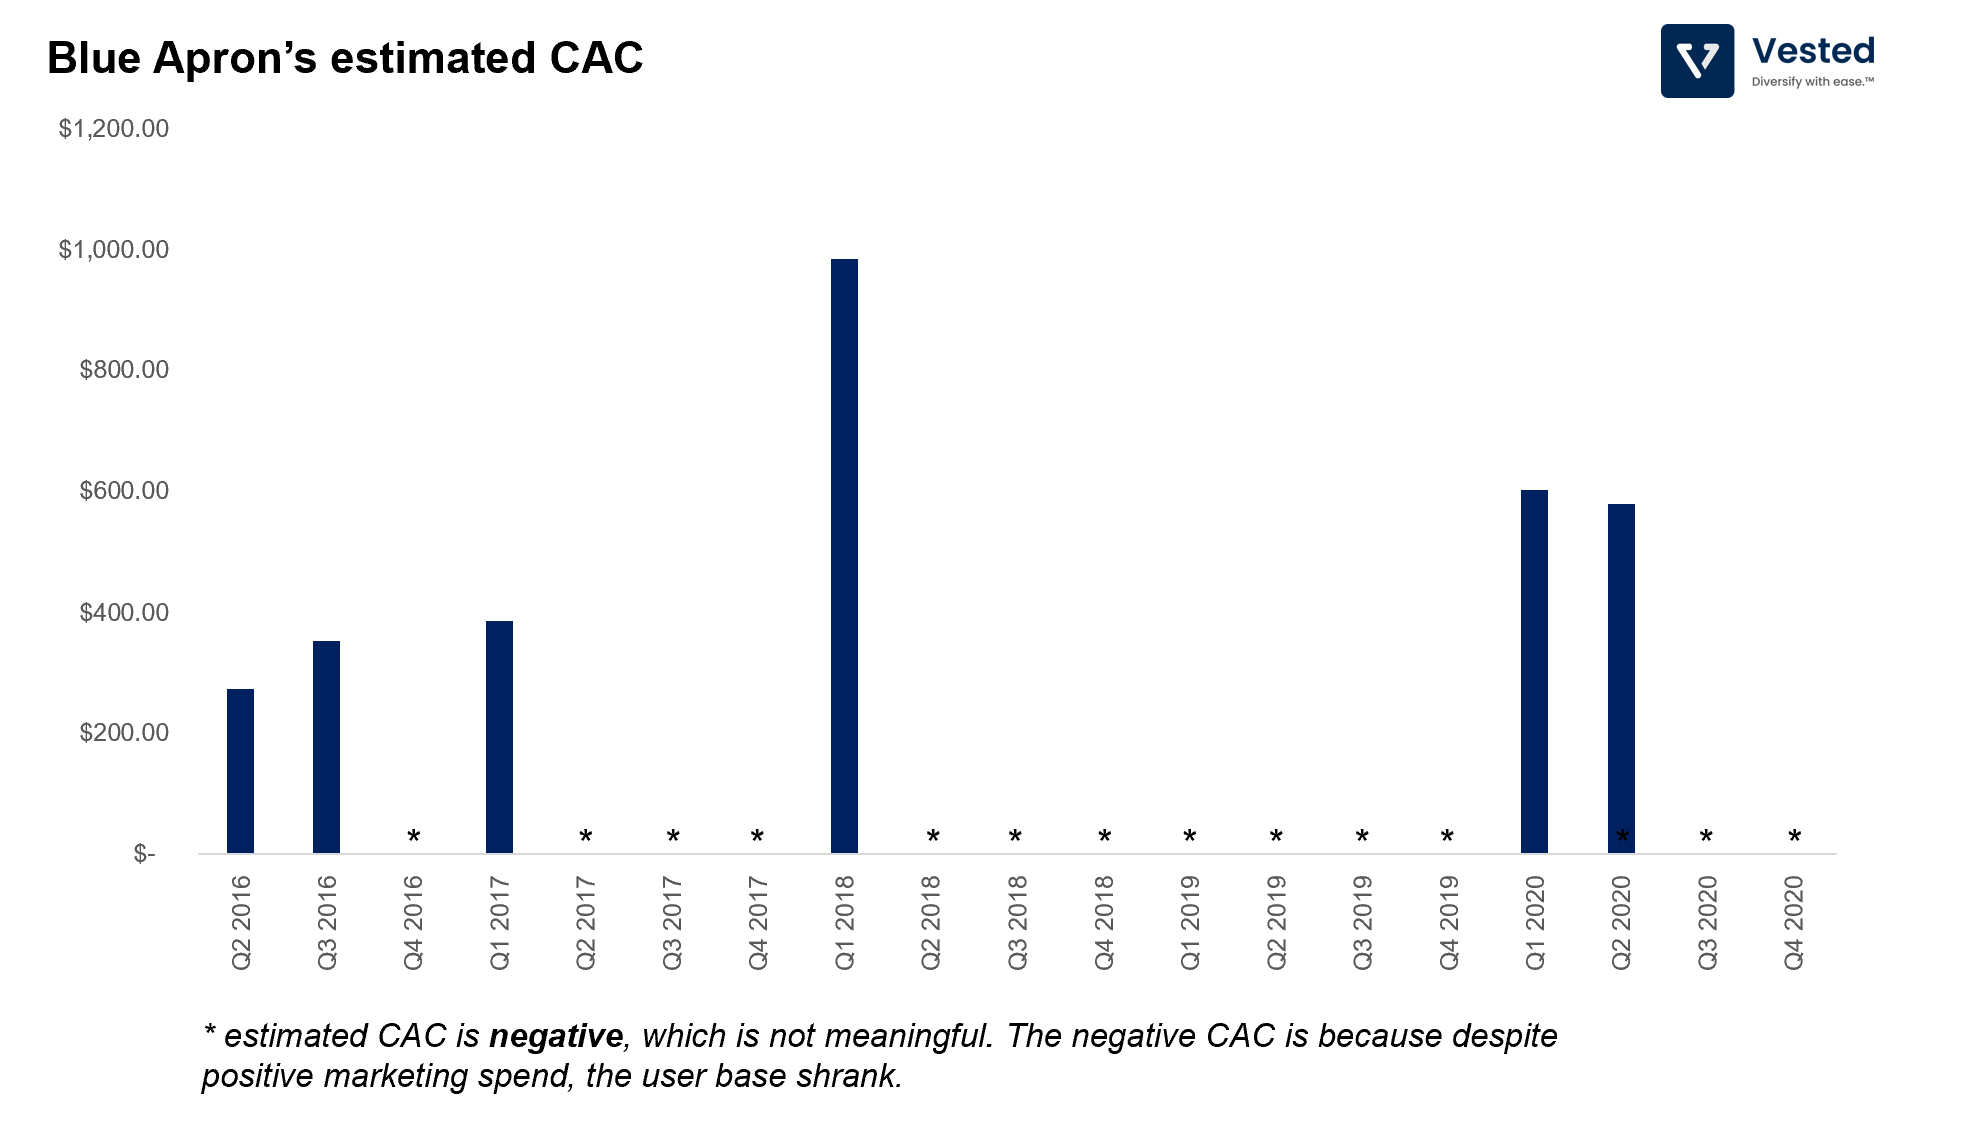
The fall of Blue Apron is because the company was not able to maintain a stable CAC. One can estimate the CAC by dividing marketing expenses by the number of new subscribers acquired in the same period (Figure 7).

The estimated CAC for Blue Apron over the past 5 years is shown in the chart below (Figure 8). From a Q2 2016 estimated CAC of US$273 per customer, CAC went up 3.6x to US$983 per customer. There are multiple quarters where, despite significant marketing spend, the customer base shrank. This means that there were more customers leaving the service than new customers signing up.
An example of a stable CAC: Netflix
In contrast to the Blue Apron example, Netflix, despite rapid growth, has a relatively stable CAC. Figure 9 below shows the estimated CAC trend from the past 5 years.
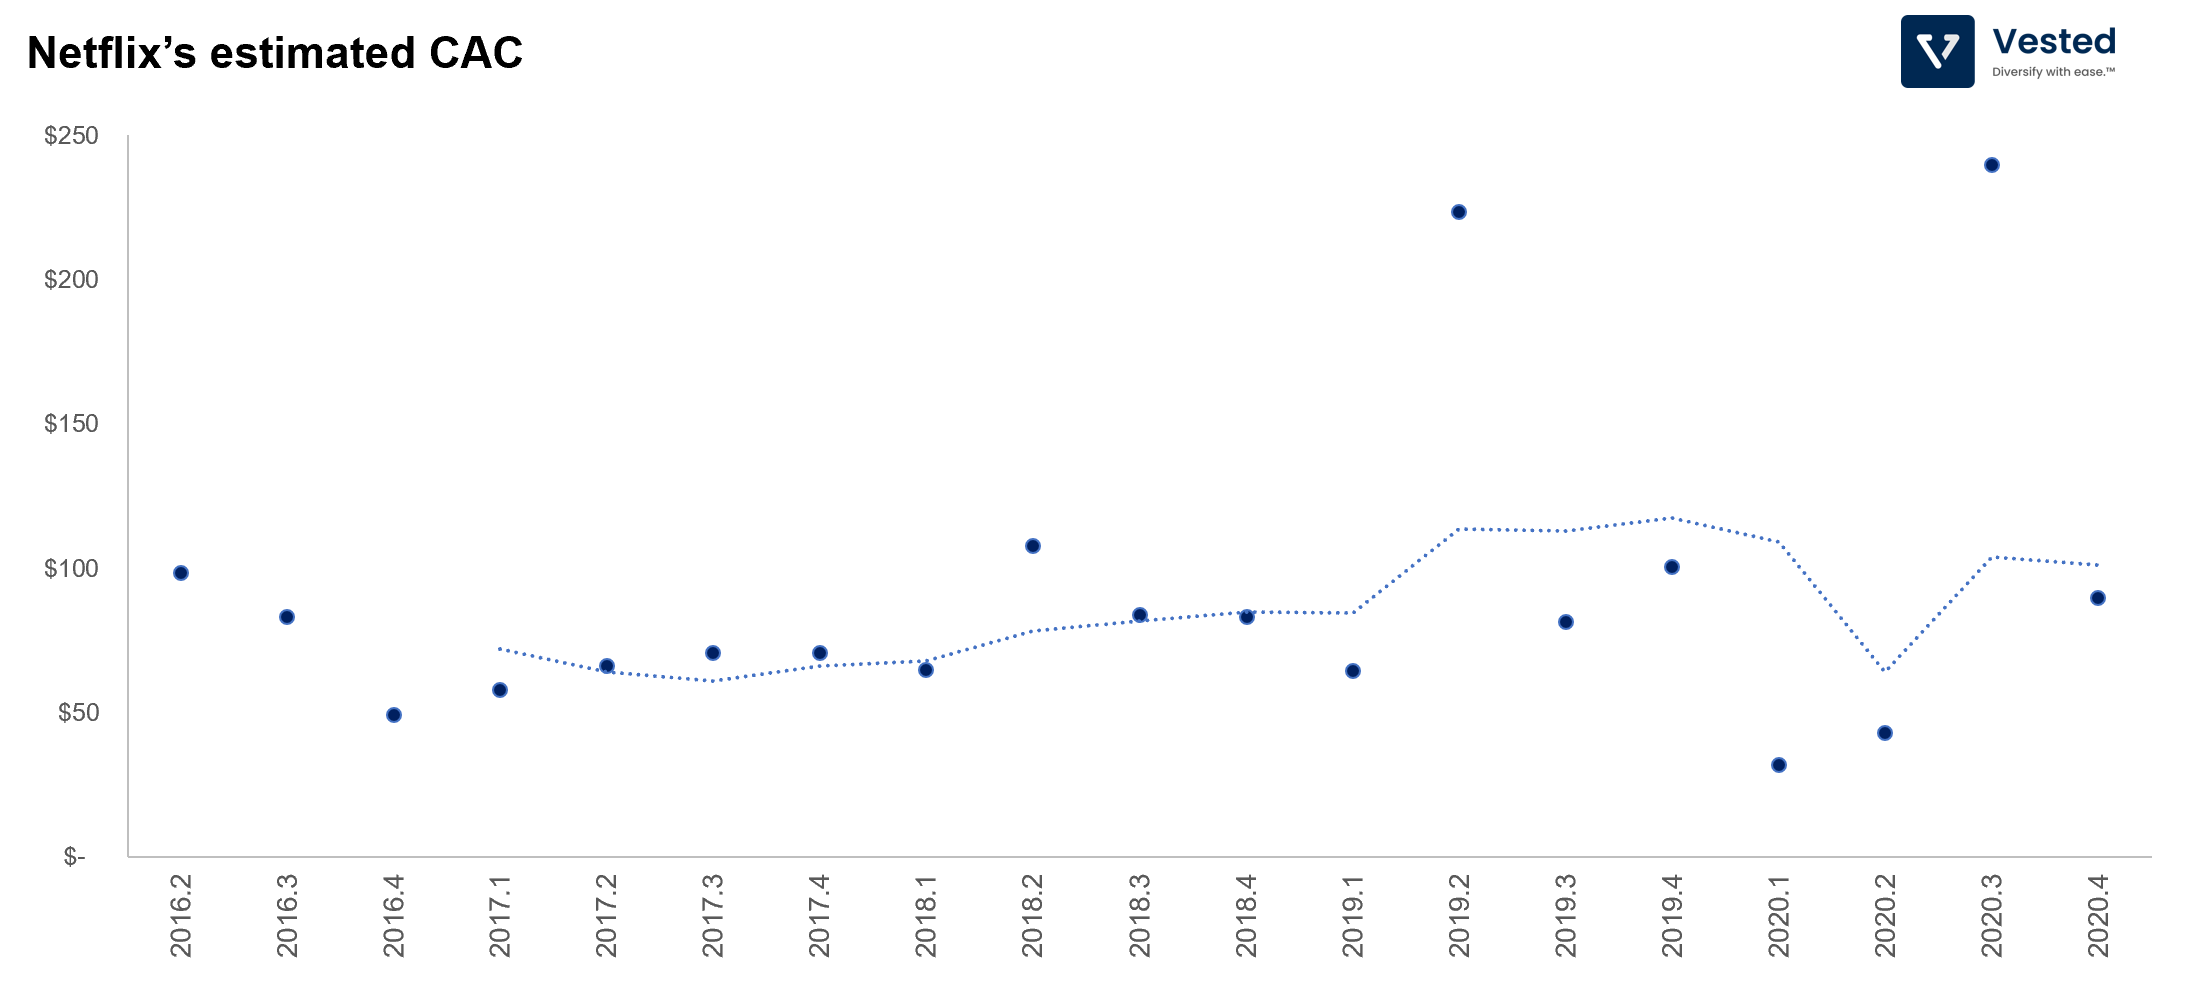
As you can see, with the exception of 2020 (where it showed higher variability due to the global lockdown), Netflix’s estimated CAC has been relatively stable over the past 5 years. In this timespan, Netflix grew its user base from 80 million to 204 million subscribers (a 2.6x increase), while maintaining a stable and predictable CAC. This is no small feat.


