 Skip to content


Investing in US stocks can be a daunting task. As an investor, you likely want to maximize your returns while minimizing your risks. However, with so many stocks to choose from, it can be challenging to identify the best investment opportunities. This is where stock screeners come in.
Stock screeners are powerful tools that allow you to filter through stocks based on your chosen criteria and identify potential investment opportunities. This article will explore three popular stock screeners – their pros/cons and how to use them effectively – and introduce a better alternative.
What is a stock screener?
A stock screener helps investors filter through thousands of stocks based on different criteria, such as market sector, price-to-earnings ratio, dividend yield, and more. Investors commonly use stock screeners to narrow down their investment options and identify potential opportunities based on their investment strategies.
Using a stock screener can help investors save time and effort by eliminating stocks that do not meet their investment objectives. Additionally, stock screeners can help investors avoid emotional decisions and focus on objective data.
How to use stock screeners effectively
To use a stock screener effectively, follow these steps:
- Identify your investment strategy: Before investing, develop a clear strategy to help you filter stocks based on your investment goals.
- Determine your criteria: Use your investment strategy to identify the criteria you’ll use to filter stocks, such as low price-to-earnings ratios or high revenue growth rates.
- Refine your results: Analyze the remaining stocks based on other factors, such as financial performance, industry trends, and market outlook, to further refine your results.
What are some popular stock screeners?
Yahoo Finance, Zacks, and FINVIZ are among the most popular stock screeners available, each offering unique features and tools to help investors find the best investment opportunities. While each tool has its advantages and disadvantages, investors should try out different screeners to find the best fit for their individual investment strategies.
Yahoo Finance stock screener
Yahoo Finance is one of the oldest and most popular financial websites, and its stock screener is free and one of the most widely used. The screener was launched in 2006 and has since undergone several updates and improvements.
The Yahoo Finance stock screener is easy to use and allows investors to filter stocks based on several criteria, such as market cap, P/E ratio, dividend yield, and more. It also allows investors to create custom screens based on their specific investment criteria. The screener also provides a range of tools and charts to help investors analyze their results.
Zacks stock screener
Zacks Investment Research is a financial research company that provides investment research and analysis to individual and institutional investors. The Zacks stock screener was launched in 2000 and has since become a popular tool for investors. The cost of using the Zacks stock screener is $249 per year.
Apart from the typical range of tools and charts, the Zacks stock screener offers more advanced than Yahoo. It allows investors to create custom screens based on their specific investment criteria. The screener provides different screening options, including growth, value, momentum, and income stocks. The screener also allows investors to backtest their investment strategies and track their portfolios.
FINVIZ stock screener
FINVIZ is a popular financial website that provides financial news, analysis, and tools for investors. The FINVIZ stock screener was launched in 2007 and has since become a popular tool for investors. The FINVIZ stock screener is free, but a premium version is available for $39.50 dollars monthly.
The FINVIZ stock screener is known for its advanced screening capabilities, including the heatmap and other tools to identify potential investments. It also provides a range of tools and charts to help investors analyze their results. The screener offers various screening options, including fundamental and technical analysis.
Shortcomings of most stock screeners
One of the most difficult steps of screening stocks is selecting the appropriate threshold for a screen. When setting up a screener, the user typically sets a fixed threshold to search for stocks above or below said threshold on different key metrics such as volume, market cap, P/E ratio, FCF, revenue, etc. Therefore, most traditional stock screeners require the user to have some knowledge of these metrics. But using a fixed threshold is flawed since thresholds often change over time. A threshold that uses nominal dollar values should change over time due to the effects of inflation and the expansion of the stock market.
For example, a large market cap ten years ago is not the same as a large market cap today. Apple, the largest stock in 2011, had a market cap of $349.9 billion at the time. Today, Mastercard, with roughly the same valuation, doesn’t even make the top 10. Similarly, if an investor uses revenue as a threshold, then they have to recognize that the nominal value of revenue in relation to the size of the company will change over time. One dollar in 2010 is equivalent in purchasing power to about $1.38 today.
Another reason why using a fixed threshold number is a flawed approach is that these threshold changes as a function of different sectors and different macroeconomic regimes.
- Different sectors have different specific numbers: As of May 2023, banks have an average P/E ratio of approximately 8.5, while travel service companies have an average P/E ratio of 30.9.
- Different periods have different valuations: In 2010, the S&P 500 had an inflation-adjusted Shiller PE ratio of 15. As of May 2023, the average S&P 500 Shiller PE is 28.6 (see below for the time trend of Shiller’s PE ratio). If you’re looking for companies that have lower valuations than the S&P 500, the value you would use would be different in 2010 vs. 2023.
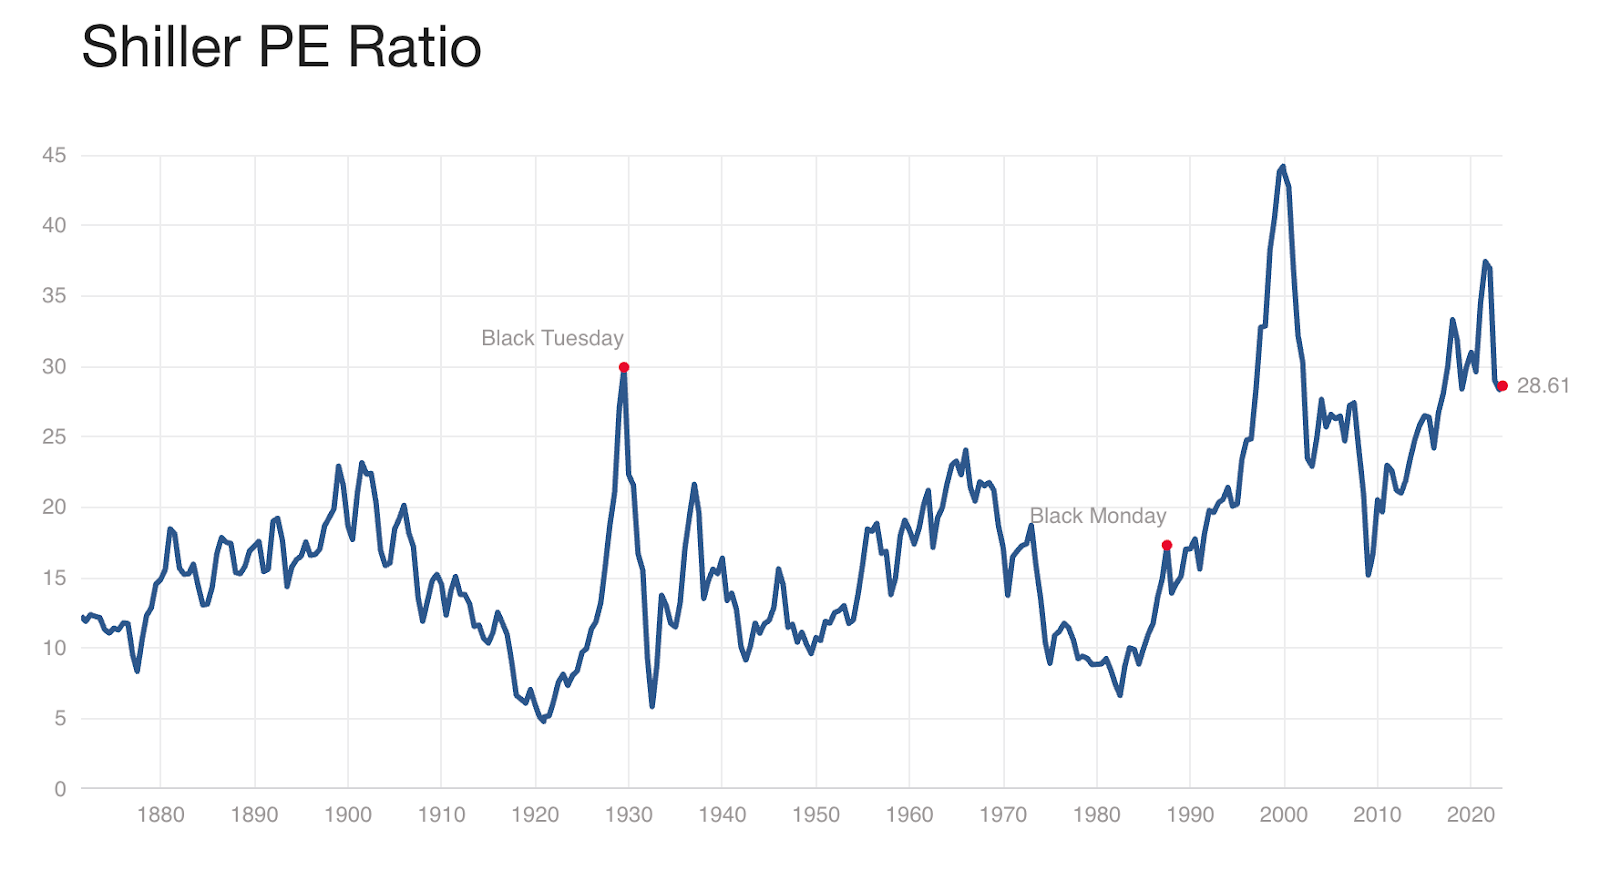
Figure 1: Shiller PE ratio from 1870 to 2020.
As you can imagine, establishing a good/bad threshold for screening stocks over time is challenging. The thresholds tend to vary over time. But the approach that most investors use is that of memorizing fixed value or using some heuristics.
Recognizing the weaknesses of these approaches, we have created AlphaScreener.
Introducing AlphaScreener
AlphaScreener was designed by Vested to assist users in formulating investment strategies based on both fundamental and technical signals. The platform allows users to shortlist companies, create multiple watchlists, and screen securities using human-readable language.
At any given moment, of all publicly traded companies, there exist good and bad stocks (when viewed through whatever lens the user chooses to employ). One way to shortlist good companies from bad ones is by stack ranking them. With this approach, one does not need to know the specific criteria to choose. For example, if the user wants to find companies that have good operating margins, the user does not need to know the margin value. The user can just stack rank all companies by the operating margin, from best to worst. With AlphaScreener, you can do this easily.
AlphaScreener allows the user to stack currently active stocks using various fundamental and technical filters. Users can further layer these filters. For example, if a user wants to find highly profitable companies, the user can set the filters to be (1) top 5% companies with the highest operating margin that are (2) large cap, and (3) top 10% ROIC (see Figure 2 below).
Figure 2: AlphaScreener filters through large-cap stocks to find stocks with the top 5% operating margin during the fiscal year and return on invested capital at the top 10%.
In addition to screening functions, AlphaScreener lets you test how your portfolio would have performed historically in a look-ahead, bias-free manner. With this, users can evaluate different strategies by seeing how they would have performed over the past 20 years (see Figure 3 below). If we continue with our example shown in Figure 2 above, AlphasScreener enables the user to step back in time, look at publicly traded companies going back to the year 2000 (that were publicly listest at the time of valuation, to remove look-ahead bias), screen those active companies based on the filters above, and hypothetically invest in those companies. We call this the Backtest function. The backtest function is statistically robust, simulating multiple portfolios at different start dates and holding periods to remove the element of luck.
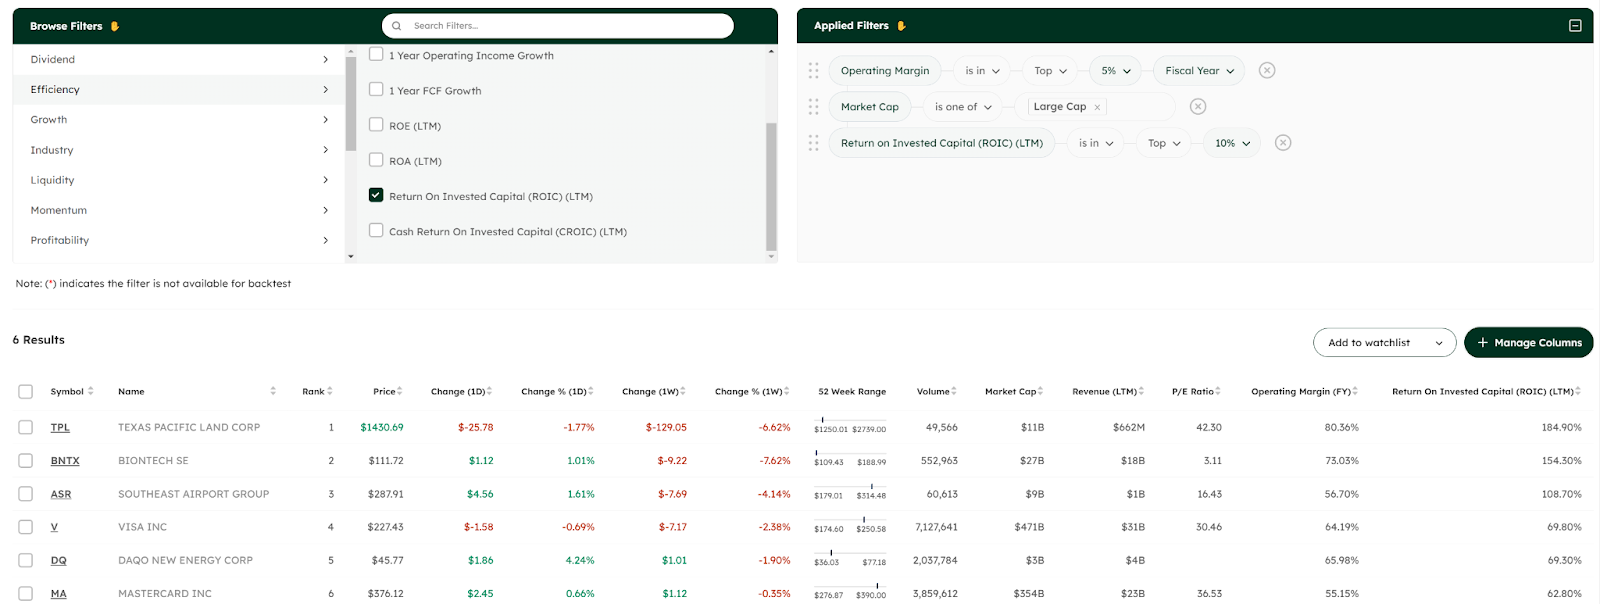
Figure 3: A hypothetical portfolio created in 2000 using the abovementioned filters beats the S&P 500.
AlphaScreener offers two pricing tiers: the basic tier is free for anyone, while the plus tier provides additional capabilities and is free for Vested Premium subscribers. To use AlphaScreener, visit https://app.alphascreener.com/ and create an account with your email, or simply sign up with Google.
