 Skip to content


There seems to be a lot of bad news interspersed with good news in the economy. In today’s post, we will try to make sense of the mixed economic signals.
That’s a tall task. So, where do we begin? Let’s start in the beginning of 2021. At the time, inflation in the US had only just started to tick up. At first, the numbers were not alarming, because of easy comparison against the previous year rates, which were low (due to the global lockdown in the spring of 2020). But in April and May 2021, the inflation rates accelerated.
During this time, the Fed (the US Central Bank) kept interest rates low (between 0 – 0.25%) and continued to print money (by buying bonds). At the time, they believed inflation was “transitory”. The Fed believed that price increases should be temporary (due to interruption in the supply chain), and not lead to a prolonged bout of accelerating inflation.
“We want inflation to run a little bit higher than it’s been averaging in the last quarter century. We want it at 2%, not 1.7%,” — Fed Chairman, Jerome Powell at the time.
Months passed and the Fed didn’t change its stance. It believed that inflation would move through the economy as the supply chain sorted itself out. But from April 2021 to November 2021, the inflation rate continued to accelerate from 4.2% to 6.8%. It was clear then that inflation is not only driven by supply disruption, but also prolonged elevated demand levels. By November of 2021, Jerome Powell finally abandoned the “transitory” label, as the inflation rate continued to accelerate.
To make matters worse, more supply shocks came in 2022. In April 2022, China imposed stringent lockdown restrictions to maintain their COVID-Zero policy, contributing to global supply chain disruptions, and at the end of February 2022, Russia invaded Ukraine, which, not only ignited a humanitarian crisis in the region, but also ignited further fuel and food price inflation.
Here’s what that journey looks like in a chart.

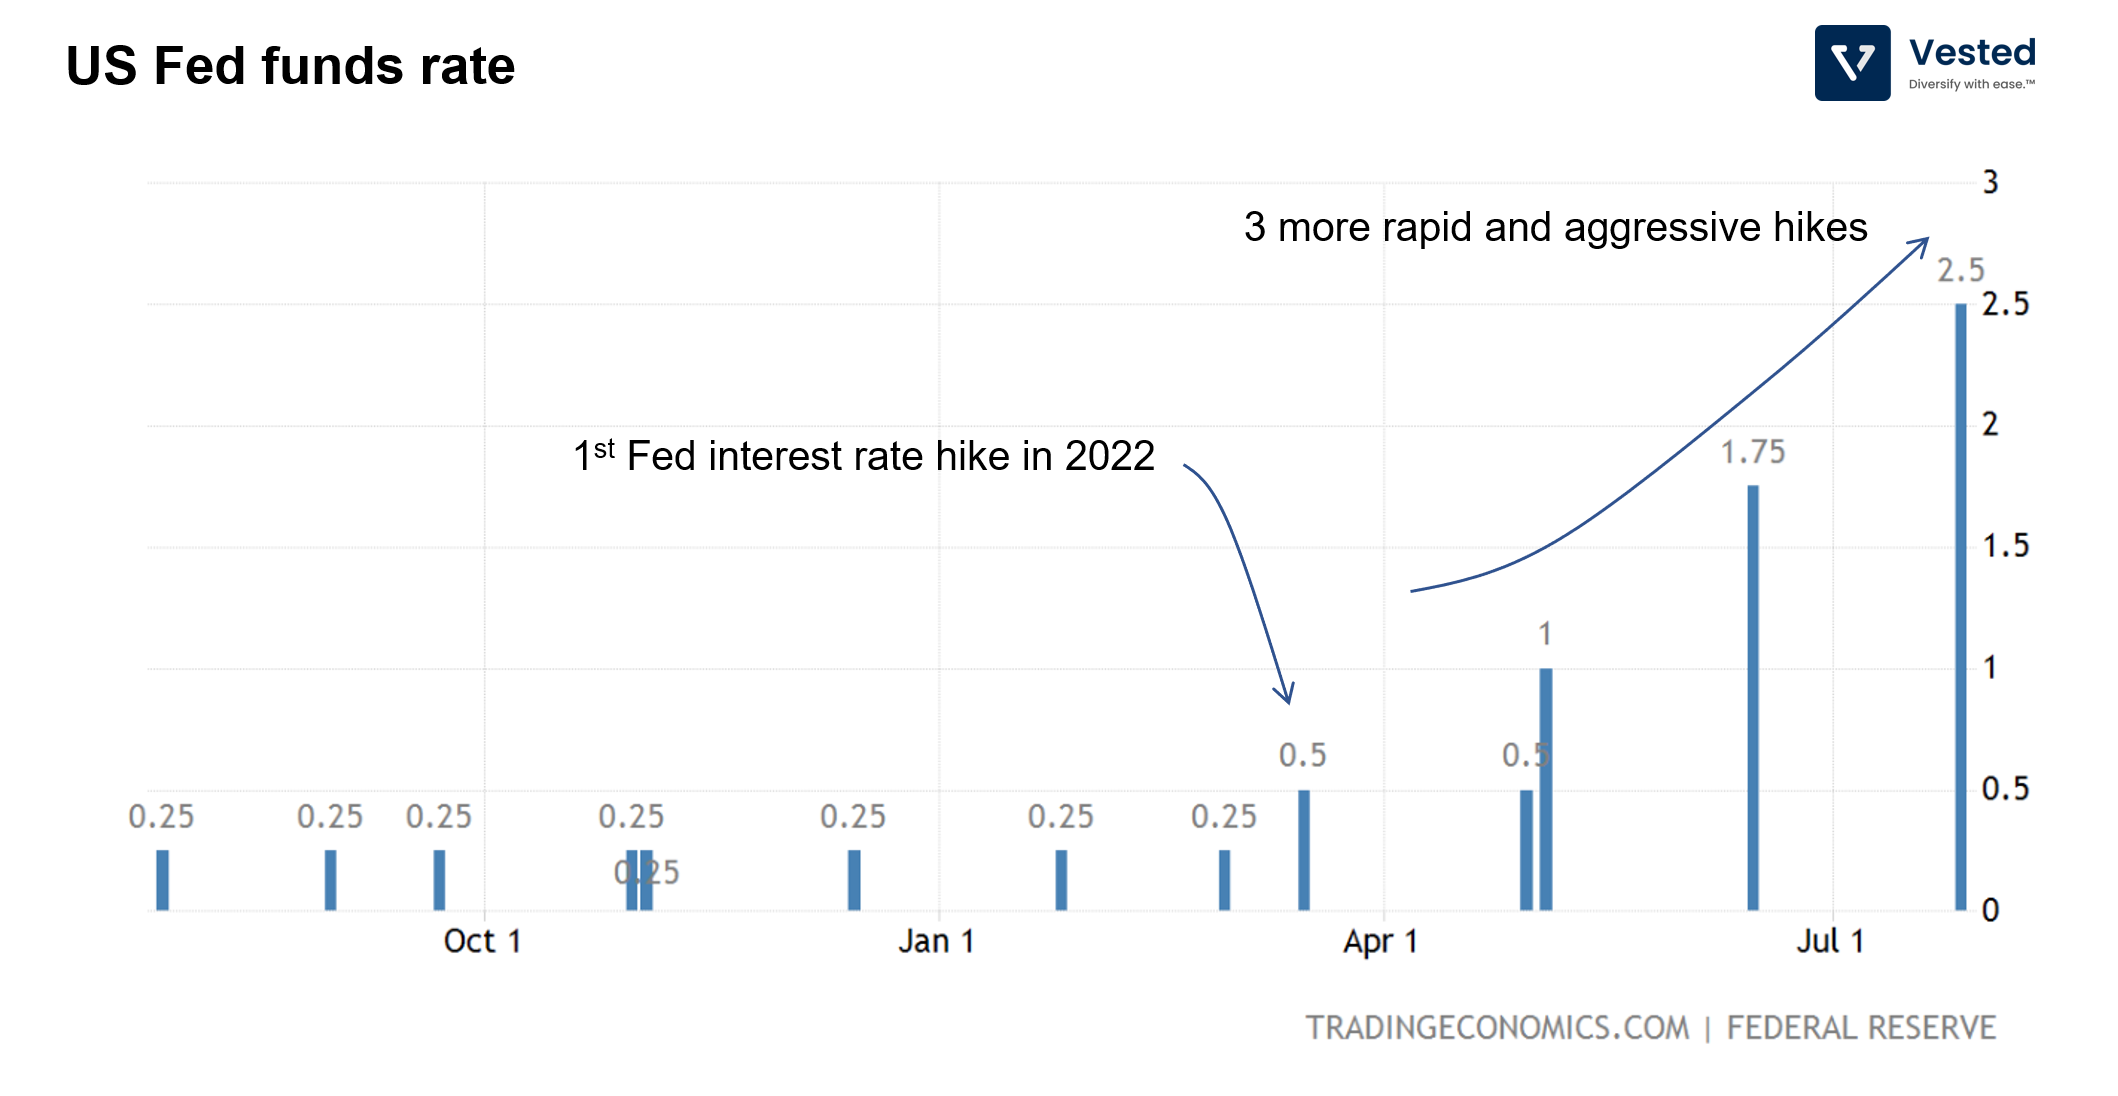
So, after being caught flat footed, the Fed decided to resolutely attack the inflationary pressure head on, with rapid and aggressive interest rate increases. Nevertheless, after ditching the “transitory” label in November 2021, the first interest rate hike only occurred in March 2022. Since then, the Fed has carried out three more hikes, making this the fastest interest rate increase in decades (see Figure 2).
As we previously outlined, inflation happens when there’s a demand imbalance – too much demand chasing too few goods. The problem is, the Fed’s primary tool, interest rates, is a tool to modulate demand. By increasing interest rates, the Fed (and central banks in other nations) hope to destroy demand. When interest rates are higher, it costs more to borrow money (impacting both individuals and businesses) to invest, to purchase homes and cars, etc.
The Fed is trying to strike a balance between reducing demand in the economy to slow down inflation, but not by too much as to cause a recession (to achieve a soft landing). Recession is the ultimate destroyer of demand since it is accompanied by an increase in unemployment – nothing will slow down consumption faster than losing one’s job. This presents a contradiction for the Fed. The Fed has two mandates: (i) maximum employment and (ii) price stability. When it has to choose one, it appears that it prioritizes price stability.
As we mentioned before, high inflation is fueled by both elevated demand levels and disruption in supply. The two shocks (China’s prolonged lockdowns and the Ukraine war) are exogenous shocks that disrupt supply. The Fed cannot do anything about that. Stopping the money printer and increasing interest rates do not increase oil or food supplies.
After the rapid interest rate hikes, will inflation slow down?
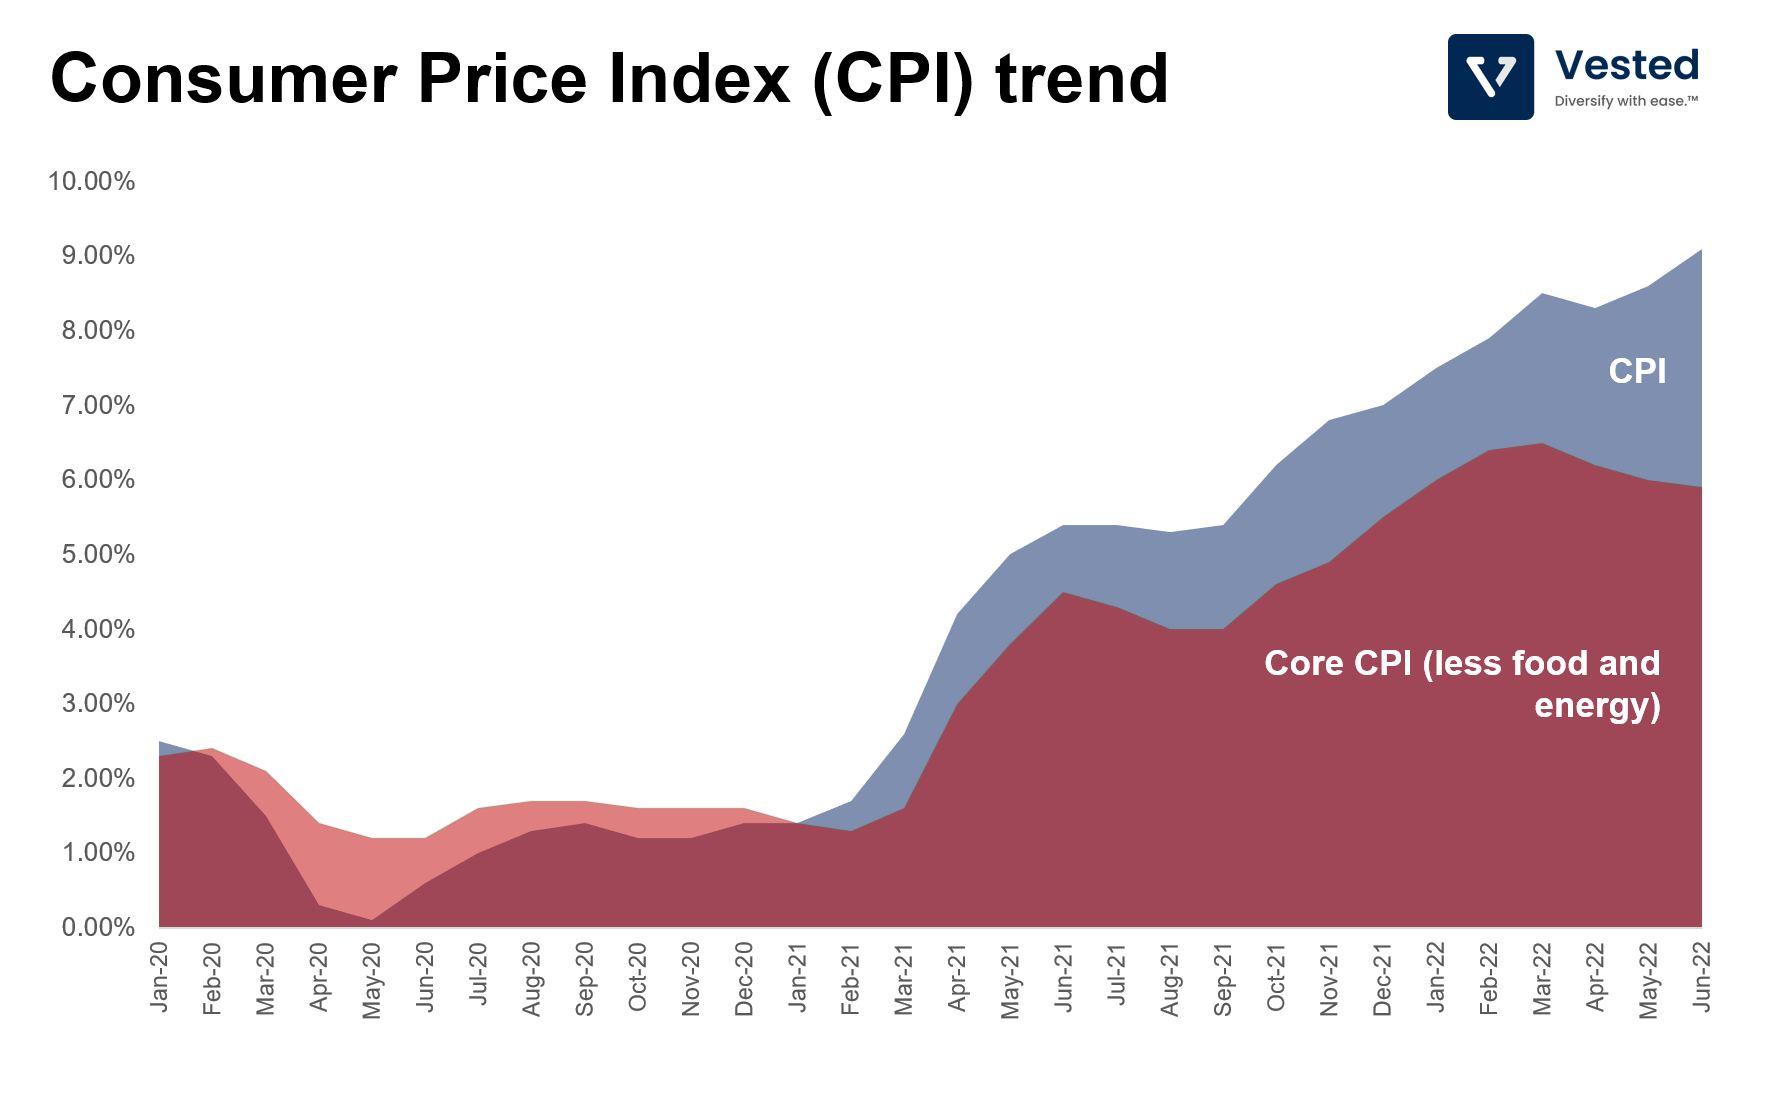
To answer this question, we need to understand the drivers of inflation. If you dig deeper into the drivers of inflation, you will discover that the increases in energy and housing costs are primary drivers. Higher energy costs bleed through to other parts of the economy: the cost of heating and cooling your homes, fertilizers, food, and other commodities. If you exclude the increase in food and energy costs, the June 2022 9.1% inflation rate goes down to 5.9%, which is still very high number (see Figure 3).
Higher interest rates cannot make energy cheaper. Of the remaining inflation pressure, the single largest driver is housing costs. There’s a housing shortage in the US, largely due to underbuilding, as many home builders were still stinging from the collapse of the housing bubble in 2008. The Fed cannot solve this by interest rate increase either. So, as you can see, the Fed has a very imperfect tool to solve the high inflation problem, which means that it has a difficult task, with the tools it has, to push inflation down to its long term target of 2%.
What does this all mean? For the economy and for the stock market?
Increase in Fed interest rate, practically speaking, increases the cost of money for everything.An increase from 0.25% rate to the current 2.5% Fed funds rate represents roughly a 10x increase in cost of capital. This creates a massive ripple effect in the global economy.
For the stock market
This means a decline in returns for stocks. But the decline is not experienced equally. The worst performers are stocks of companies that do not generate free cash flows from their business (think sharing economy companies, fintechs, cash burning SaaS companies). In contrast, cash generating businesses are not as impacted. To see the diverging performance of these two class of companies, you can see Figure 4 below, where we plot the returns of the following (from March 2022 to today):
- Russell 2000 index, which represents the broader market
- Nasdaq index, which represents higher risk tech companies
- FTSE High dividend yield index, which represents cash generating companies
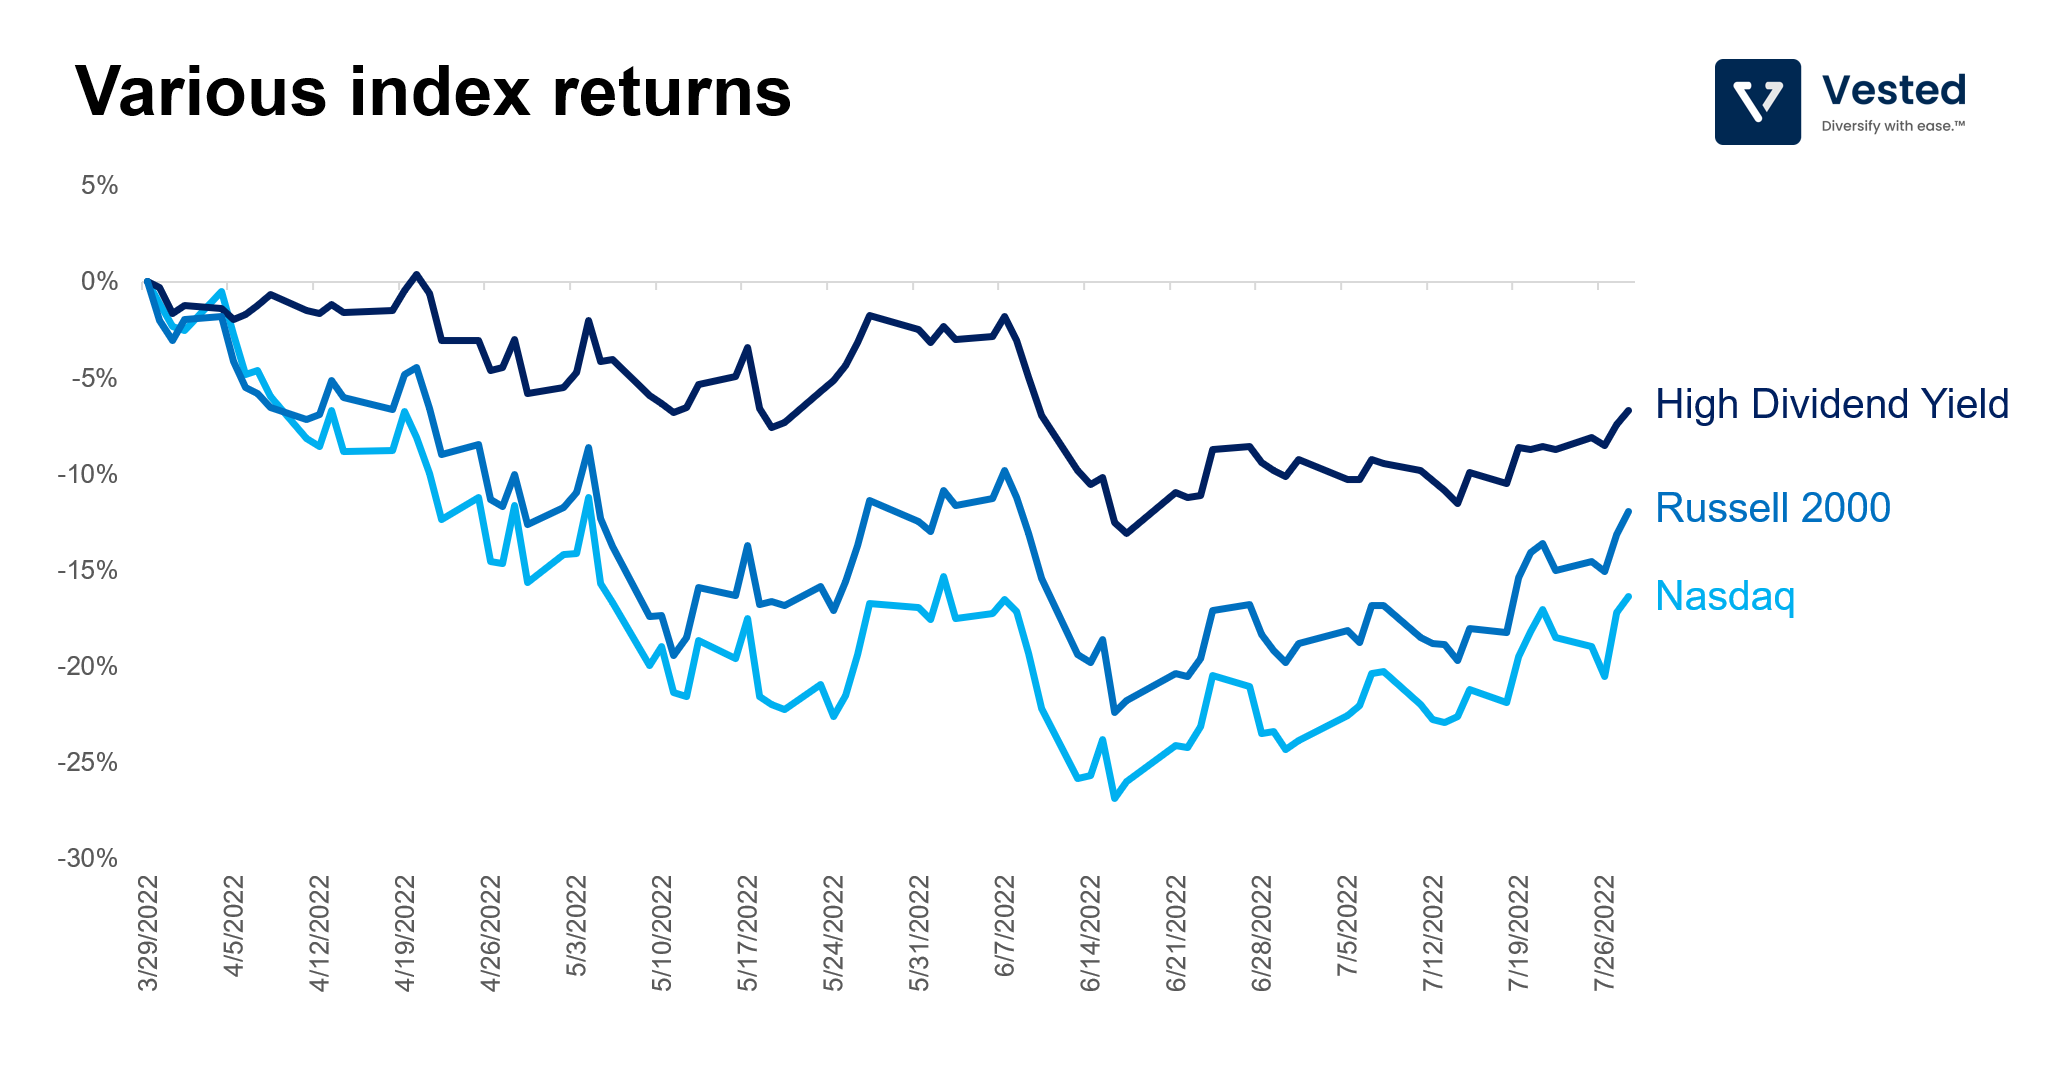
As you can see above, the return profiles are different. Dividend yielding companies, by virtue of their ability to generate cash from their own businesses, will be less impacted by the increase in cost of capital. In an environment where cost of capital is high, the ability to generate your own cash is more valuable. This is why higher interest rates have crushed prices of risky assets, not just stocks: crypto, NFTs, private companies valuations, and debt-fueled private equity deals. In other words, this new era represents an investing regime change (if you’re interested in reading more about this, read this excellent piece by Professor Aswath Damodaran).
In thinking about how to navigate the changing interest rate regime, we have developed AlphaScreener to better screen and carry out backtests using various fundamental filters (note: this is a preview. Alphascreener will be released next week). In Figure 5 below, we show a sample screening strategy that filters for companies with (i) strong Free Cash Flow (FCF), (ii) that is growing its FCF, and (iii) not microcap stocks.
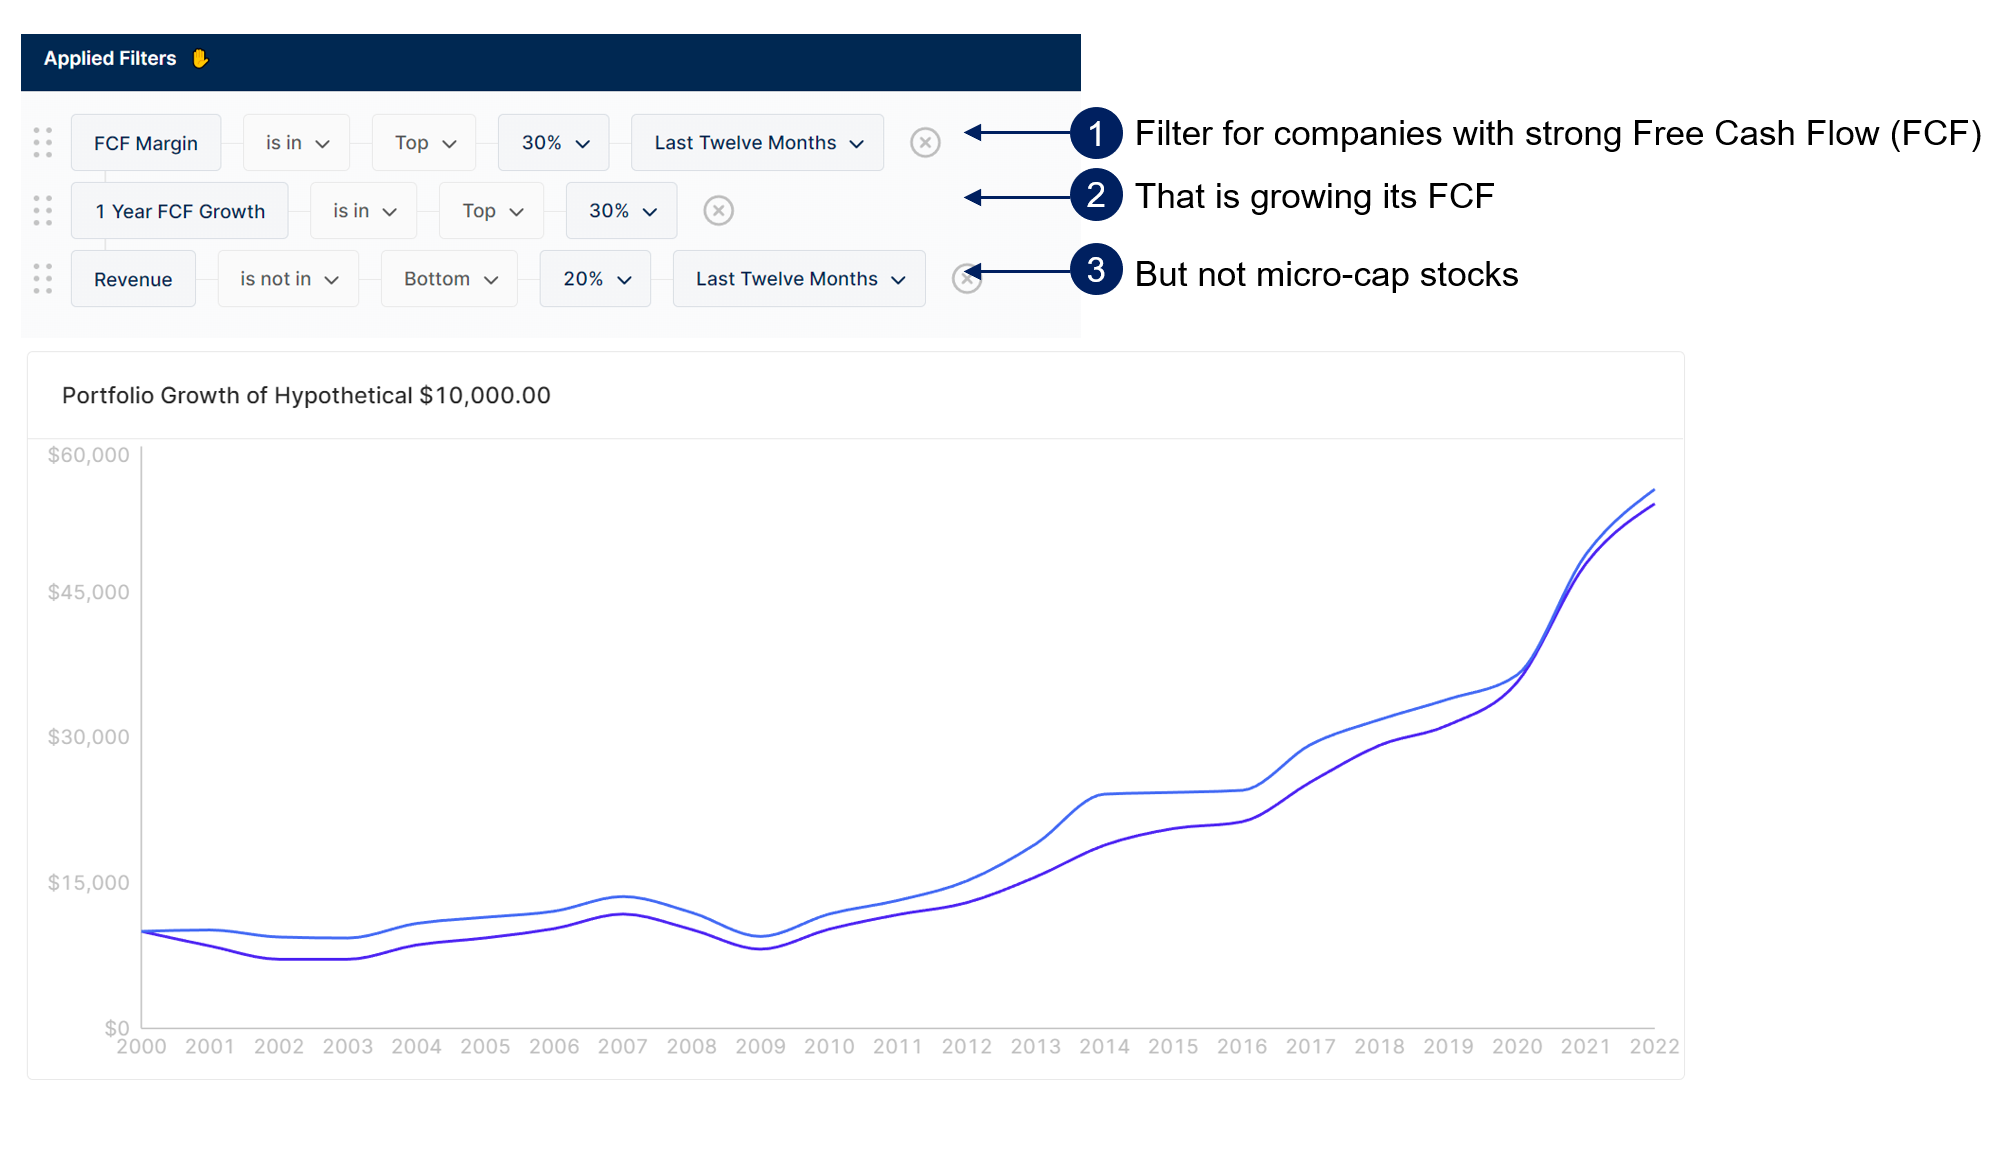
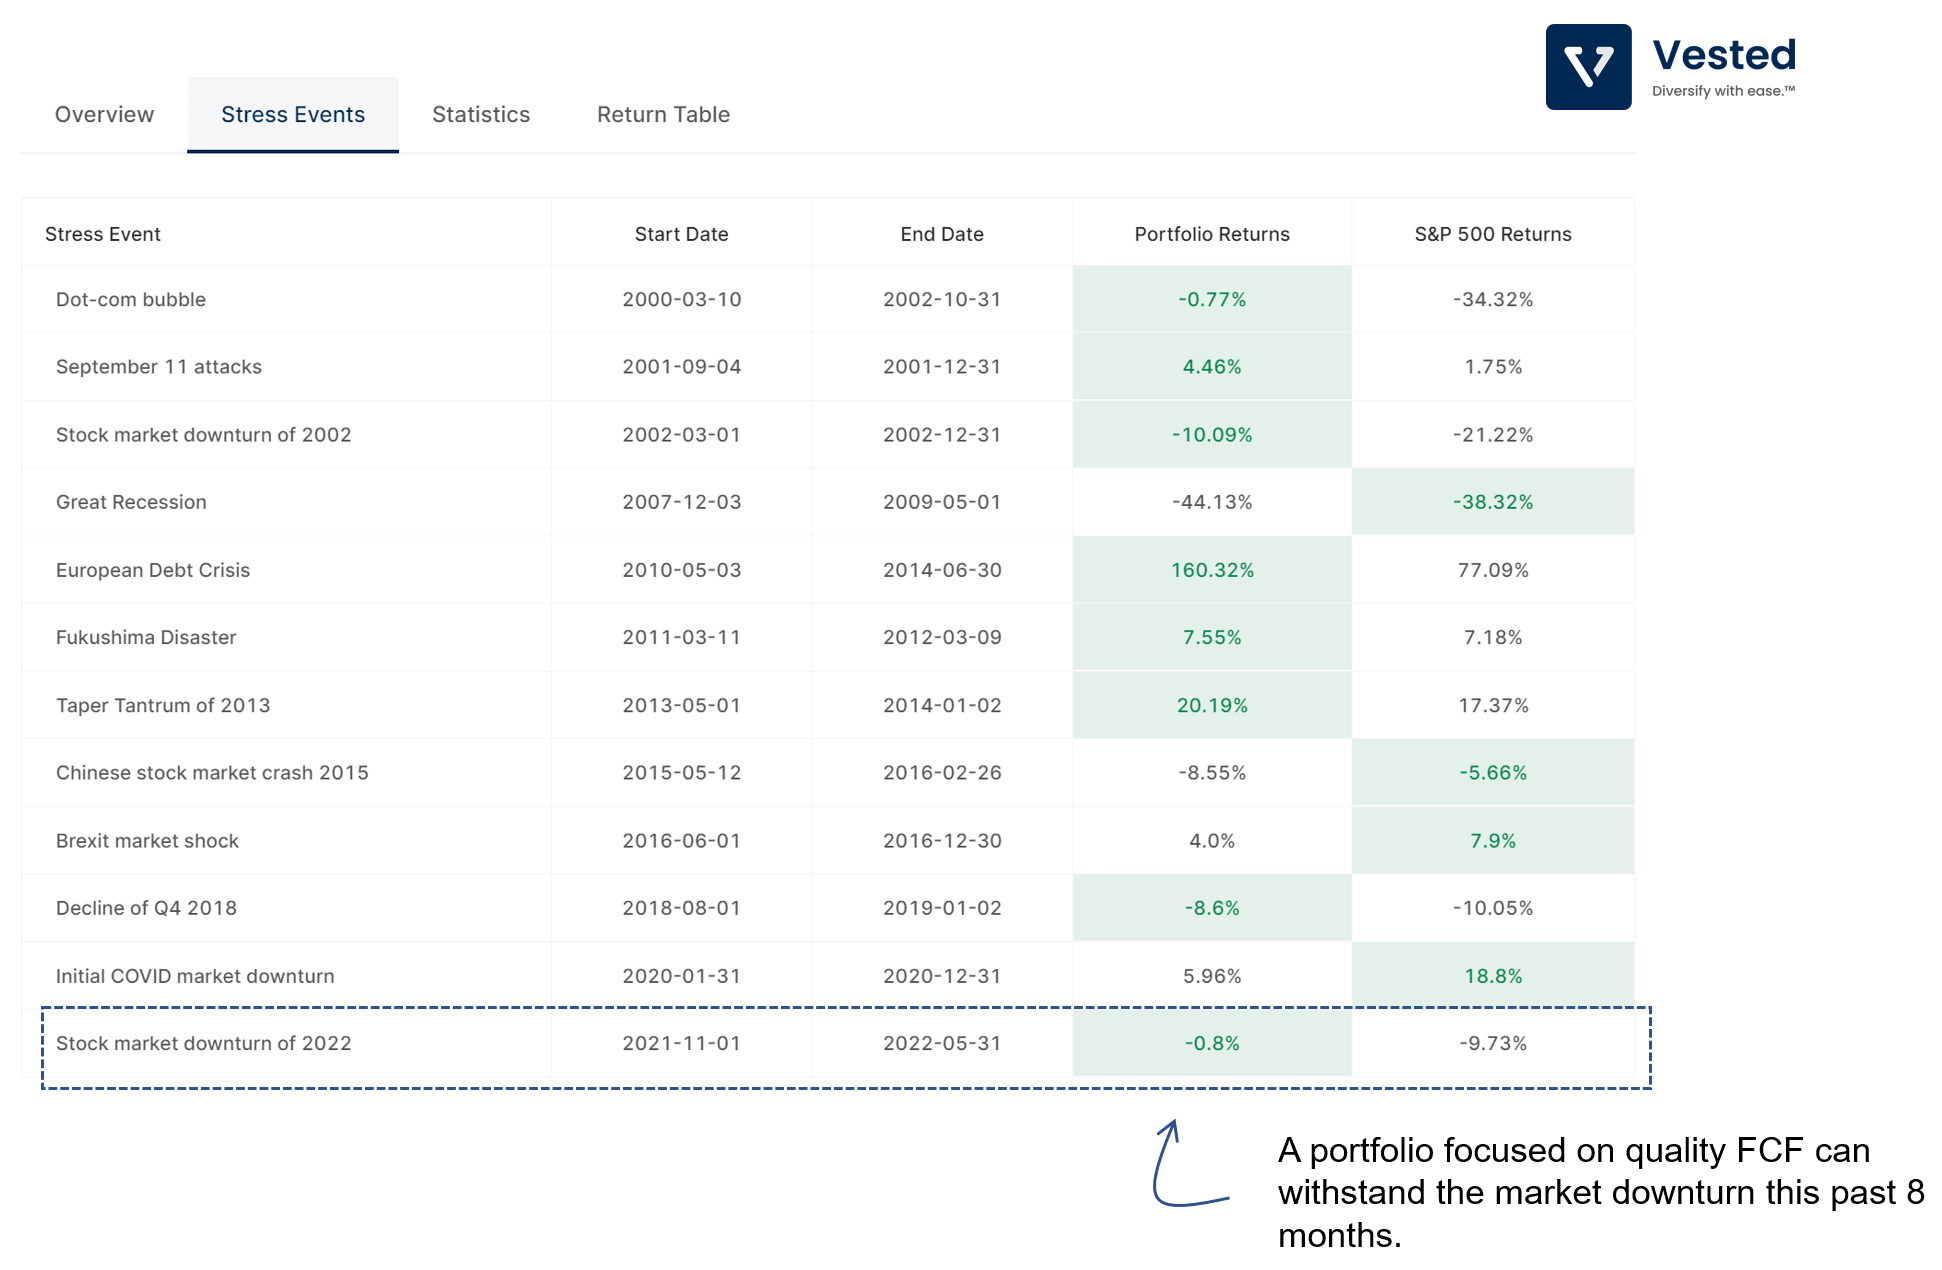
And, as it turns out, you can significantly outperform the market this past 8 months by shifting your strategy to a more cash flow oriented one. In Figure 6 below, we show the hypothetical portfolio returns of the FCF strategy, over various stress events. Pay particular attention to the last row: the market downturn in the high inflation/high interest rate regime.
For lending companies
More expensive cost of capital is really bad for lending companies. When interest rates are low, lending fintech companies can get cheap cash to lend out. But in a higher interest rate world, that source of capital dries up. In recent months, Affim, a buy now pay later (BNPL) firm had to cancel its loan sale after one of its purchasers demanded a higher interest rate on the deal. Klarna, a BNPL firm from Europe, experienced an 85% valuation decline.
For the demand side of the economy
The rapid increases in interest rates, combined with higher costs of everything, should be clamping down demand and economic activities broadly. That is why everyone is so concerned about a recession. News headlines are consistently negative. Consumer sentiment is at a decade low. Google searches for the keyword “recession” is trending up. So things are bad, right?
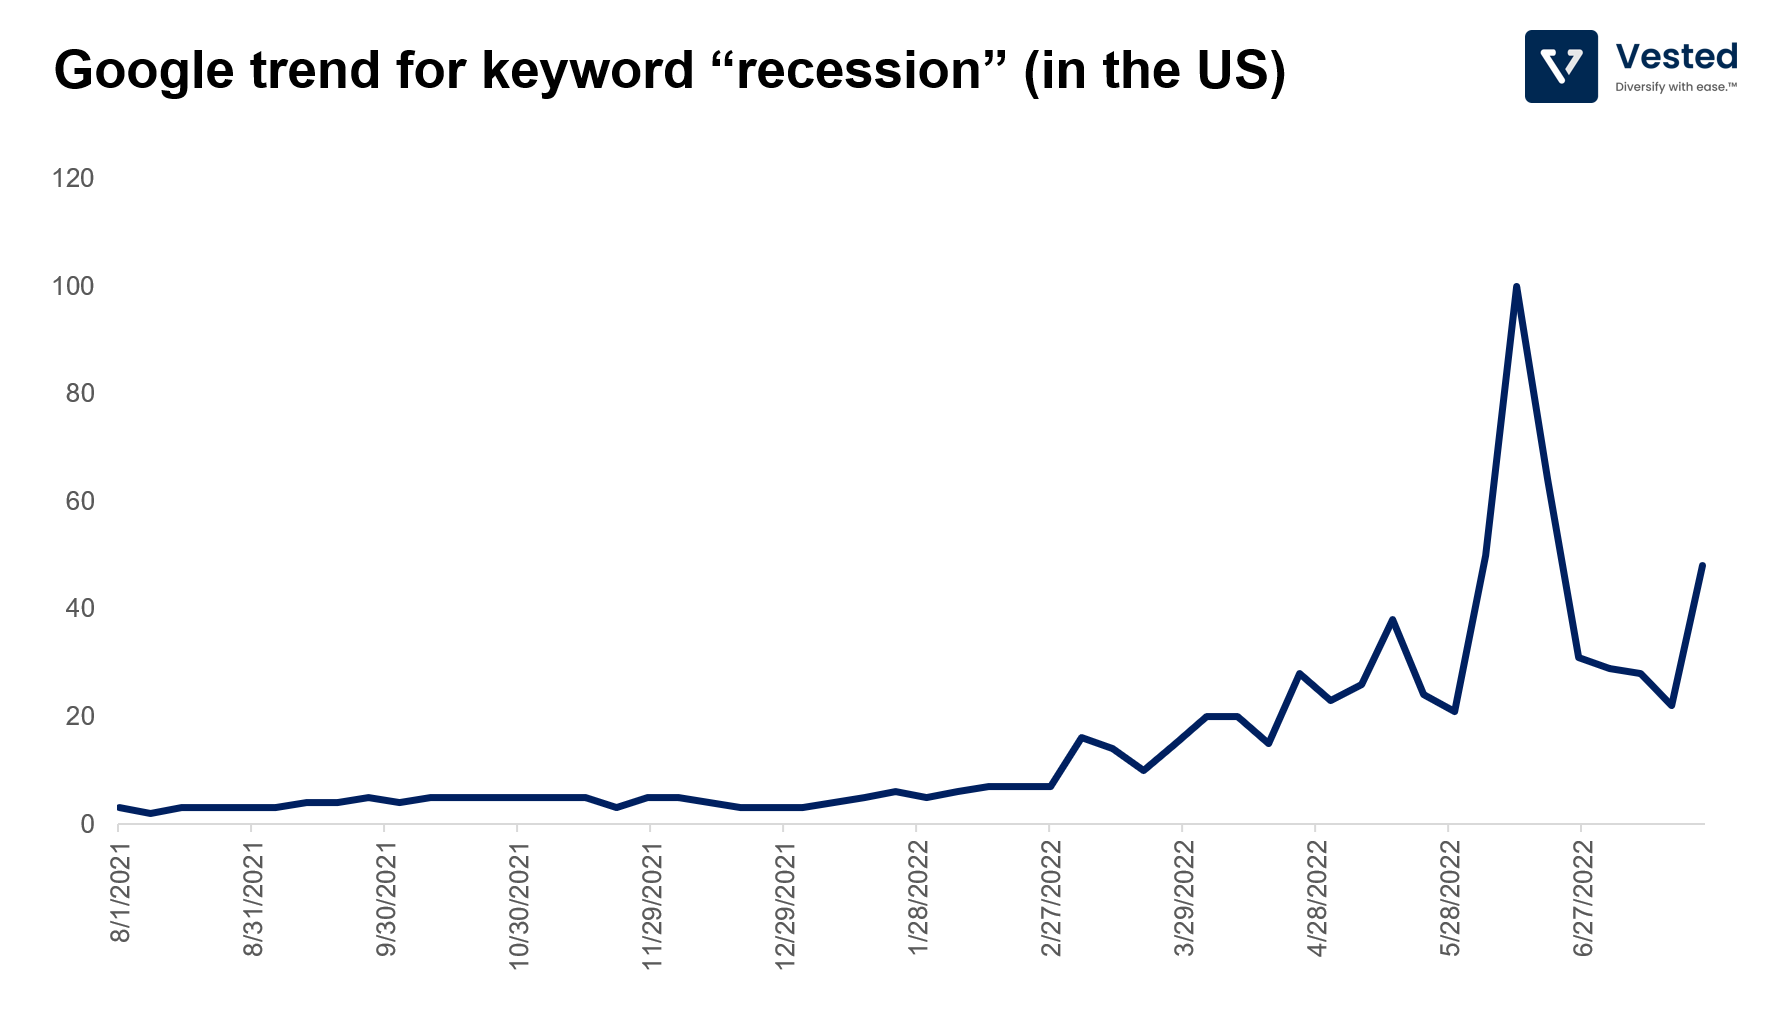
Not really. Despite the negative sentiment data, there are lot of people are still spending, and the employment condition is still very strong:
- Visa beat its latest earnings, thanks to strong consumer spend.
- JPMorgan made similar observations on the strength of the consumer balance sheet in the US.
- Unemployment rate is at a 20 year low, at 3.6%, the same level as pre-pandemic, and commensurately, the job openings rate is also at a record high.
The mixed signal is confusing. The negative consumer expectations do not match their reality.
But after its fourth rate increase this year, the Fed has definitely weakened the economy, particularly economic activities in the production sectors.
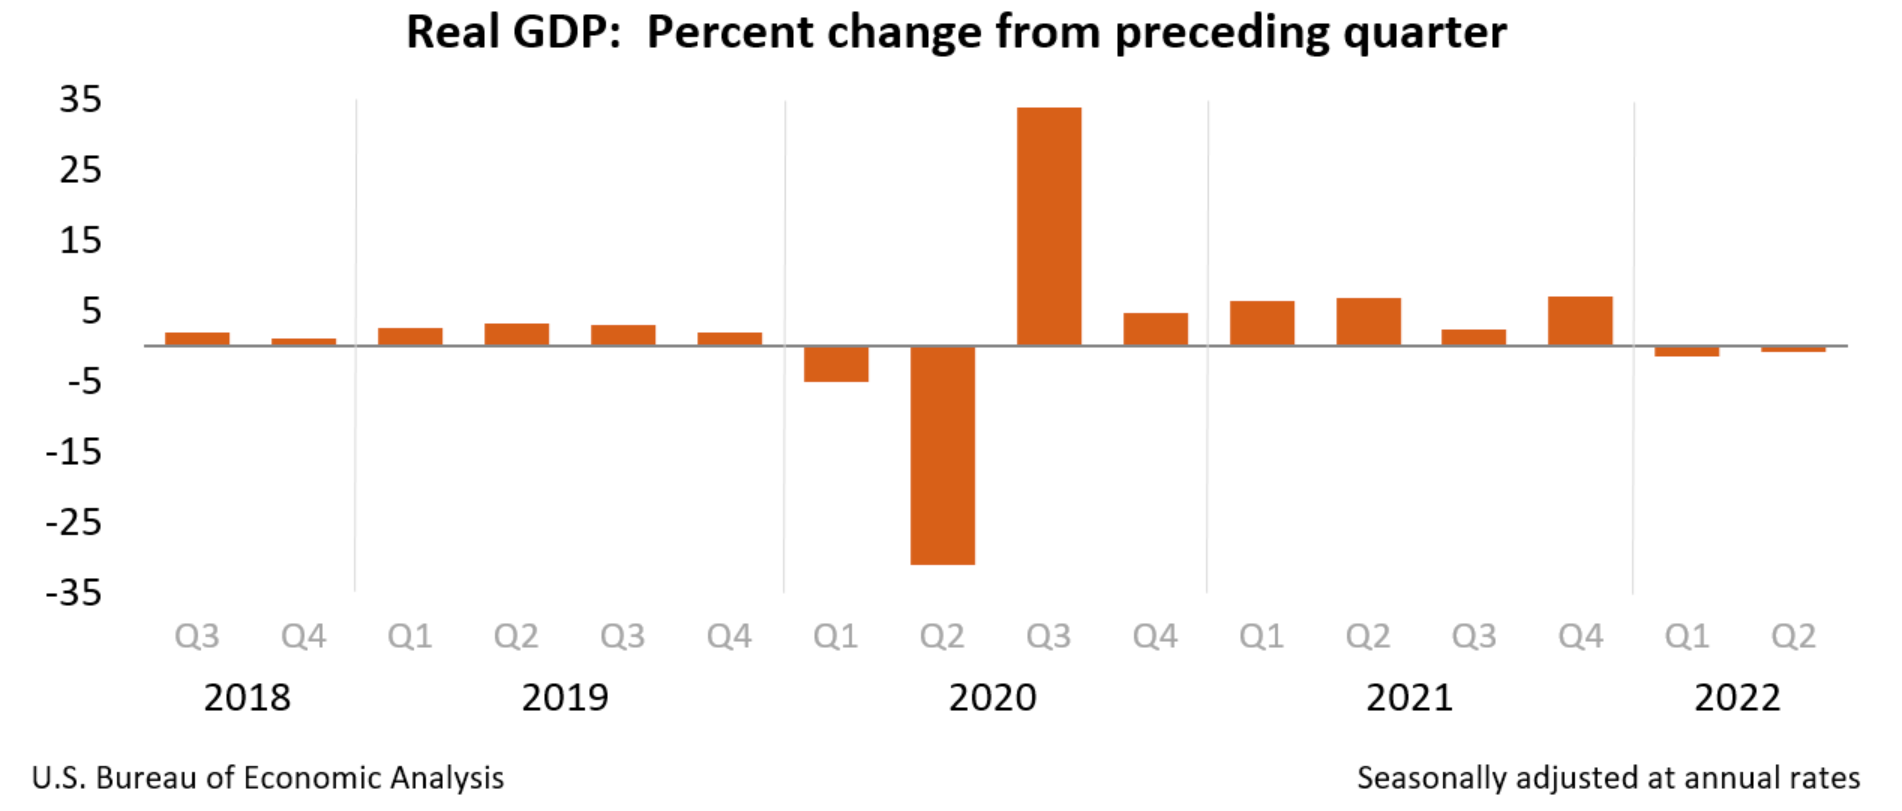
The weakening was enough to push US GDP growth to contract for two quarters in a row (see Figure 8), which is the technical definition of a recession – but the US is not officially in a recession until the NBER says so, and turns out, two sequential quarters is not the official definition that the NBER uses to define a recession. For example, in the early days of COVID, the US entered and exited a recession rapidly. The recession officially lasted for only two months (not two quarters).
But back to our GDP data: In Q1 2022, the US economy contracted by 1.6%, and in Q2 2022, it contracted by a lesser amount, 0.6%. Both numbers are negative, but seem to be trending in the right direction.
Something does not add up
Ok, time to introduce a new term: the GDI. GDI is short for Gross Domestic Income. It is a measure of economic activity that counts the total income of everyone in the economy (wages, profits, and taxes). This is in contrast to the GDP, which tallies up everything that the economy produces (good, services, technology).
Theoretically, they should be equal to one another. Afterall, what one person makes, if sold, transforms into income. Coming out of the pandemic, the two started to diverge, and the discrepancy is only increasing. While production measures (GDP growth) are slowing down, income measures (GDI growth) have not. As of Q1 2022, the gap between the two is 3.5%, the largest on record (Figure 9).
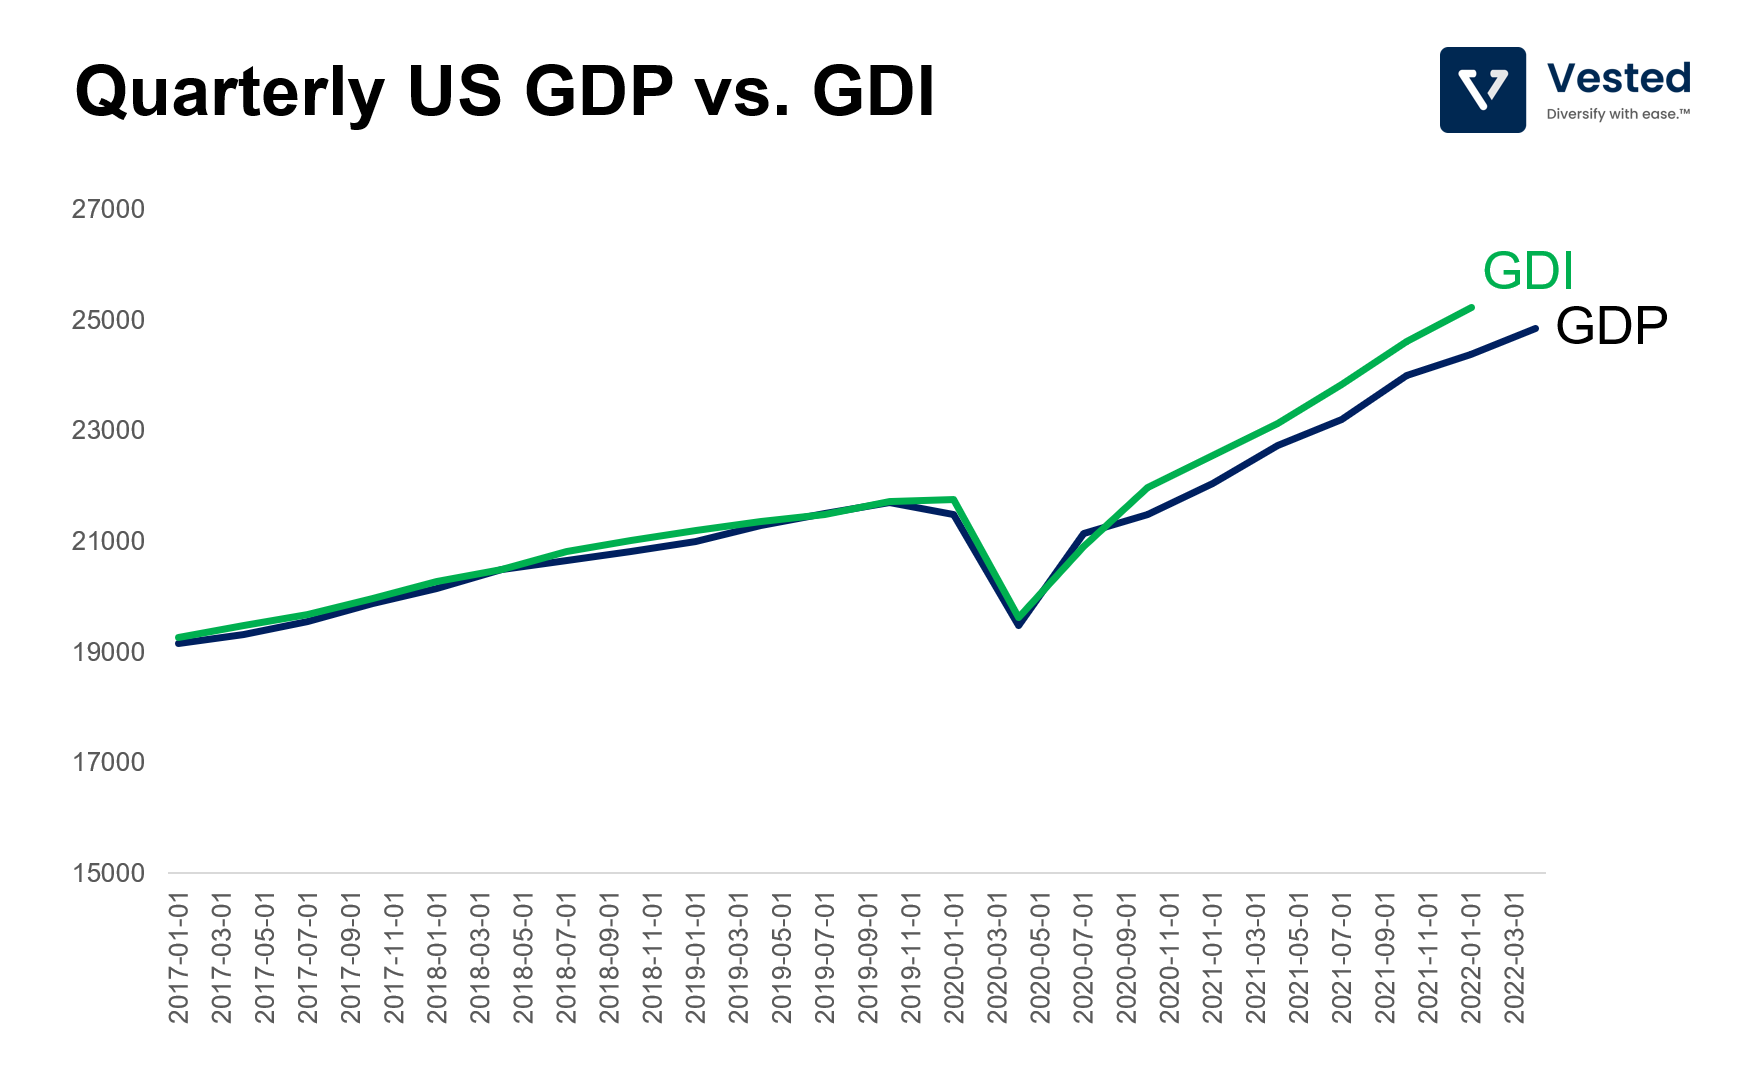
As a side note though, BEA, the folks who measure economic activities, prefer to use GDP as they consider it to be more reliable. But there’s a healthy debate between which of the two is a better measurement tool. Before the 2008 recession, GDI went down earlier and much more rapidly than that of the GDP. Some argue that GDI is more real time, and currently, it paints a stronger US economic growth than what the GDP might be suggesting.
Dollar as the safe haven
Increasing interest rates in the US has made the dollar an even more attractive safe haven in these uncertain times. Increased capital outflow into the dollar has also wobbled FX exchange rates of the USD against other currencies. USD and Euro have achieved parity (the last time this happened was 20 years ago). The Yen has also weakened to a 20 year low. Meanwhile, Indian Rupees have depreciated 15% this year alone.
A weakening of one’s currency is doubly bad for:
- Countries with a lot of dollar denominated debt, as a cocktail of high interest rates and a stronger dollar increase borrowing costs.
- Countries that rely on a lot of imports (especially energy).
- Emerging market equities, as it experiences capital outflow.
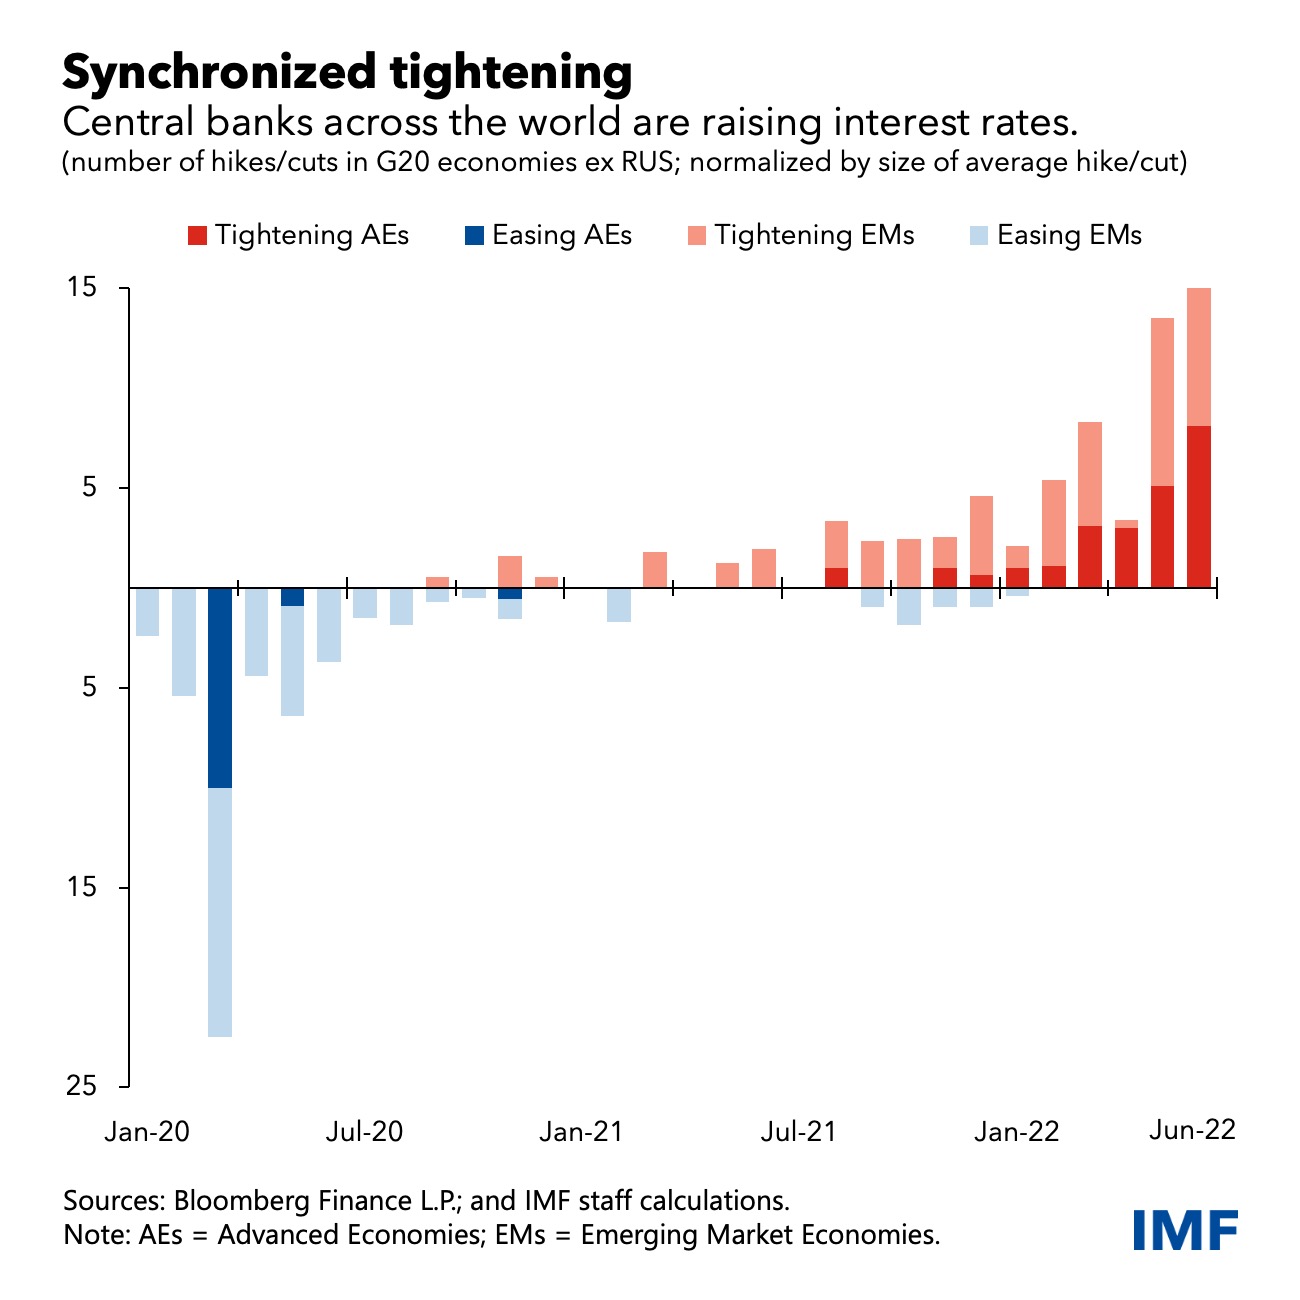
The Fed’s policy is forcing other central banks to increase rates or face capital outflow that weakens their own currencies. See Figure 10 below. More and more countries are increasing their interest rates (see red bar). The problem is, the economies of these other countries may have high dollar denominated debts, are also fighting inflation, and may be on a weaker economic footing to begin with, which means that they may not be able to handle a higher interest rate environment. So in a way, the Fed’s domestic interest rate policy becomes a global interest rate policy, or as Richard Nixon’s Treasury Secretary John Connally put it in 1971: “The dollar is our currency, but it’s your problem.”
Looking to the (near) future
In looking at what is to happen in the rest of 2022, perhaps seeing the macroeconomic conditions through the lens of big tech earnings can be useful.
Advertisement
Ads are typically a small contributor to the US GDP (less than 2% annually), but can be useful as a proxy for businesses’ sentiment. If their sentiment is negative, then businesses pull back ad spend. Here, it is useful to understand that, at a high level, there are two types of advertising: (1) brand advertising and (2) performance advertising.
Brand advertising is, as the name suggests, for market positioning and brand building. It does not typically translate to purchases in the immediate term. Think of that car ad showing a luxury sedan being driven in an idyllic mountainscape; that’s brand advertising (how else can you convince consumers to make a large purchase using debt in order to purchase a depreciating asset?).
In contrast, performance or direct advertising is tied to conversion events, whereby the consumer converts into a customer (buy a thing, subscribe to a service, etc). So, direct ads are much lower in the conversion funnel, and therefore can be better tied directly to revenue.
As you can imagine, of the two, when the macroeconomic conditions get more cloudy, companies will pull back brand advertising and keep direct ads. You see this from the earnings of the tech ad giants:
- Google, who just reported its Q2 2022 earnings, reported a diverging growth rate of its two core ads businesses. Google services (which relies on direct ads) grew 10% y-o-y. Meanwhile, YouTube (which relies more on brand ads) grew slower, 5% y-o-y.
- Meta (or Facebook), which relies more heavily on brand advertising, missed on earnings and issued weaker than expected forecasts. Revenue fell more than 1% y-o-y., and it issued a Q3 revenue guidance between $26 – 28.5 billion, below the $30.5 billion expected by investors. To be fair, Meta is facing not just weakening macro conditions, but is also experiencing lower accuracy in its conversion tracking ability (thanks to Apple’s privacy changes – ATT).
- Amazon’s advertising business, 3rd largest in the US, which is more similar to Google Search’s direct ads business, also saw respectable growth. It grew 18% y-o-y ($8.8 billion in Q2 2022).
Tech investments
We can also use Microsoft’s and Amazon’s cloud business growth to gauge the tech investments done by other companies. Migration to the cloud does not seem to be slowing down, despite heightened business uncertainties.
- Microsoft probably is the one company that best captures technology investments by small businesses and large enterprises. The company saw healthy growth in this past quarter: Revenue was $51.9 billion (up 16% in constant currency) thanks to strong Office 365 growth, LinkedIn ads, and cloud services. Of particular interest is the Azure cloud business, which grew 40% (or 46% in constant currency). The company is facing some headwinds from a stronger dollar (it reduced revenue by 4%). However, it reaffirmed its initial guidance for the rest of the year.
- Amazon saw a similarly strong growth in its cloud business. Amazon’s AWS grew at a stellar rate of 37% y-o-y, contributing towards 16% of revenue ($19.7 billion) and the vast majority of the company’s free cash flow (helping it weather increased costs in the e-commerce business).
E-commerce spending
When you look at the results of e-commerce spending, it’s a tale of the haves vs. have-nots:
- Amazon, who caters to more affluent customers, saw resilience in its business. Total online sales are flat on a constant currency basis. It also showed pricing power as it increased prime membership costs in the US and Europe without observing significant churn. The company beat analyst estimates and forecasts a 17% revenue increase in the next quarter.
- Walmart, who caters to the lower/middle income segment, struggled more and missed its latest earnings. The company saw consumer spending shifting to lower margin private food items and less on higher margin electronics and other discretionary categories. The company is also feeling pressure on wages and excess inventory. The company adjusted its full year forecast down, which caused a major sell-off of its shares.
Dead cat bounce?
After the Fed announced the latest 0.75% increase, the market, especially tech stocks, rallied. Why? It seems this is because of the speech that the Fed Chairman gave. The particular line that caught everyone’s attention is this:
“… we’ve been saying we would move expeditiously to get to the range of neutral. And I think we’ve done that now. We’re at 2.25 to 2.5 and that’s right in the range of what we think is neutral. So, the question is how are we thinking about the path forward“ — Fed Chairman, Herome Powell (source)
He also left the door open for more rate increases, depending on new data. With the latest GDP print being negative, the market is interpreting this as a signal the Fed will let off its aggressive stance. The tech sector rallied this past week. Quant traders unwinded more than $100 billion in short bets against stocks, and retail investors are buying FAANG again.
But, as we’ve outlined in the beginning of this post, even with reduced demand, we are still a long way from the 2% inflation target. So it’s still to be determined if this is a dead cat bounce or the beginning of a stock market recovery.
