Robinhood is going public in the coming weeks, and its S-1 prospectus is finally made public. In this article, we deep dive into Robinhood’s business.

Robinhood
The global pandemic and the ensuing lockdown was devastating for the world, but in the world of retail investing, the events in the past 18 months have accelerated adoption. This is true globally. At the back of this macro tailwind, numerous fintechs are capitalizing the recent growth spurt and are going public. And one of the largest is Robinhood.
Unprecedented growth
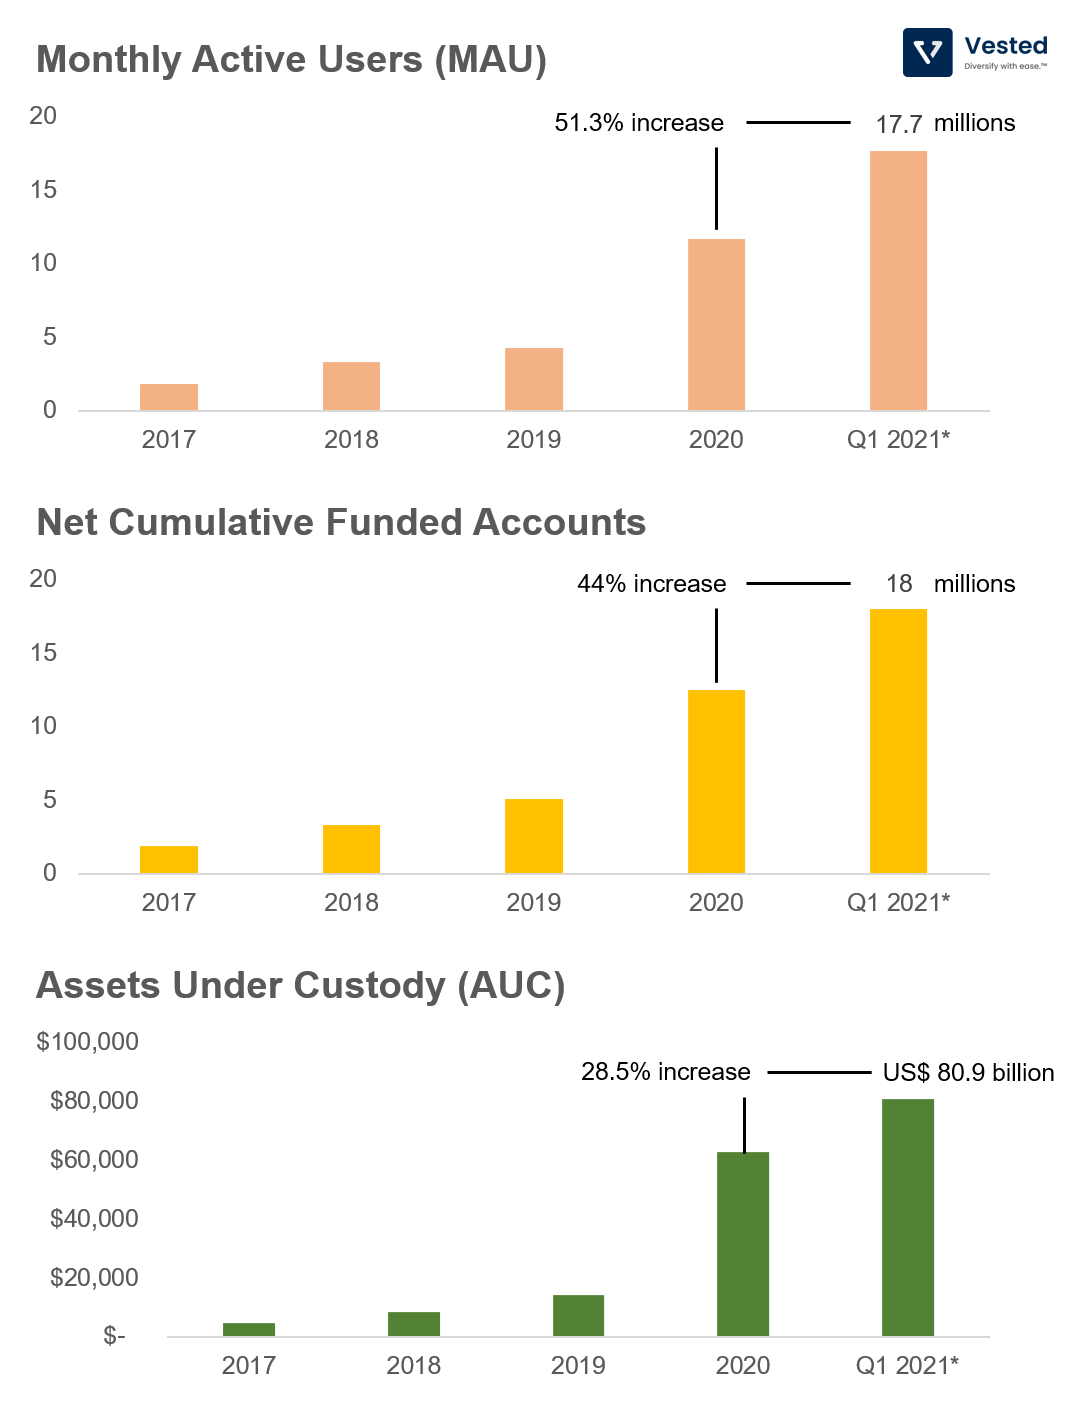
With more than 18 million funded accounts and US$80.9 billion assets under custody (AUC), Robinhood has become one of the largest retail brokerages in the US. Its recent growth has been propelled by two macro events: (1) the US stock market‘s sharp decline with the global lockdown in 2020, which increased participation of retail investing in the US, and (2) the rise of meme stocks.
To say that the company experienced rapid growth may understate the impact of events from the past 18 months to Robinhood’s business. See Figure 1 for the company’s key metrics.
When a company – any company – achieves this massive of a scale so quickly, it attracts more media attention (mostly bad) and scrutiny from regulators. The scrutiny is multi-faceted, which we will expand more on later), but specifically on how it makes money.
How Robinhood makes money
Robinhood revolutionized the brokerage industry in the US by providing zero commission trading. It was the first to do so, attracting millions of new investors into the fold. After years of resisting, other brokerages were forced to follow suit in 2019.
Robinhood’s revenue stream can be broken into three segments:
- Transaction-based revenue: A majority of Robinhood’s revenue (81%) is transaction-based. For equity and options trading, the company makes money by sending retail users’ order flow to different market makers. The amount of revenue is a function of fixed percentage of the difference between the publicly quoted bid and ask at the time the trade is executed (note: this is called Payment for Order Flow, or PFOF, a practice that is receiving increased scrutiny from the SEC). For cryptocurrency trading, the company generates transaction rebates.
- Net interest revenue: About 12% of Robinhood’s revenue is from interest earned from margins and securities lending.
- Other revenues: This segment includes monthly premium subscriptions (Robinhood Gold), ACATS fees charged to users when they transfer their holdings out, and other fees. This is the smallest segment of the company’s income stream, contributing towards only 8% of total revenue. As of Q1 2021, Robinhood has 1.4 million Gold subscribers (an increase from 0.3 million a year ago).
Here’s how its revenue growth looks like:
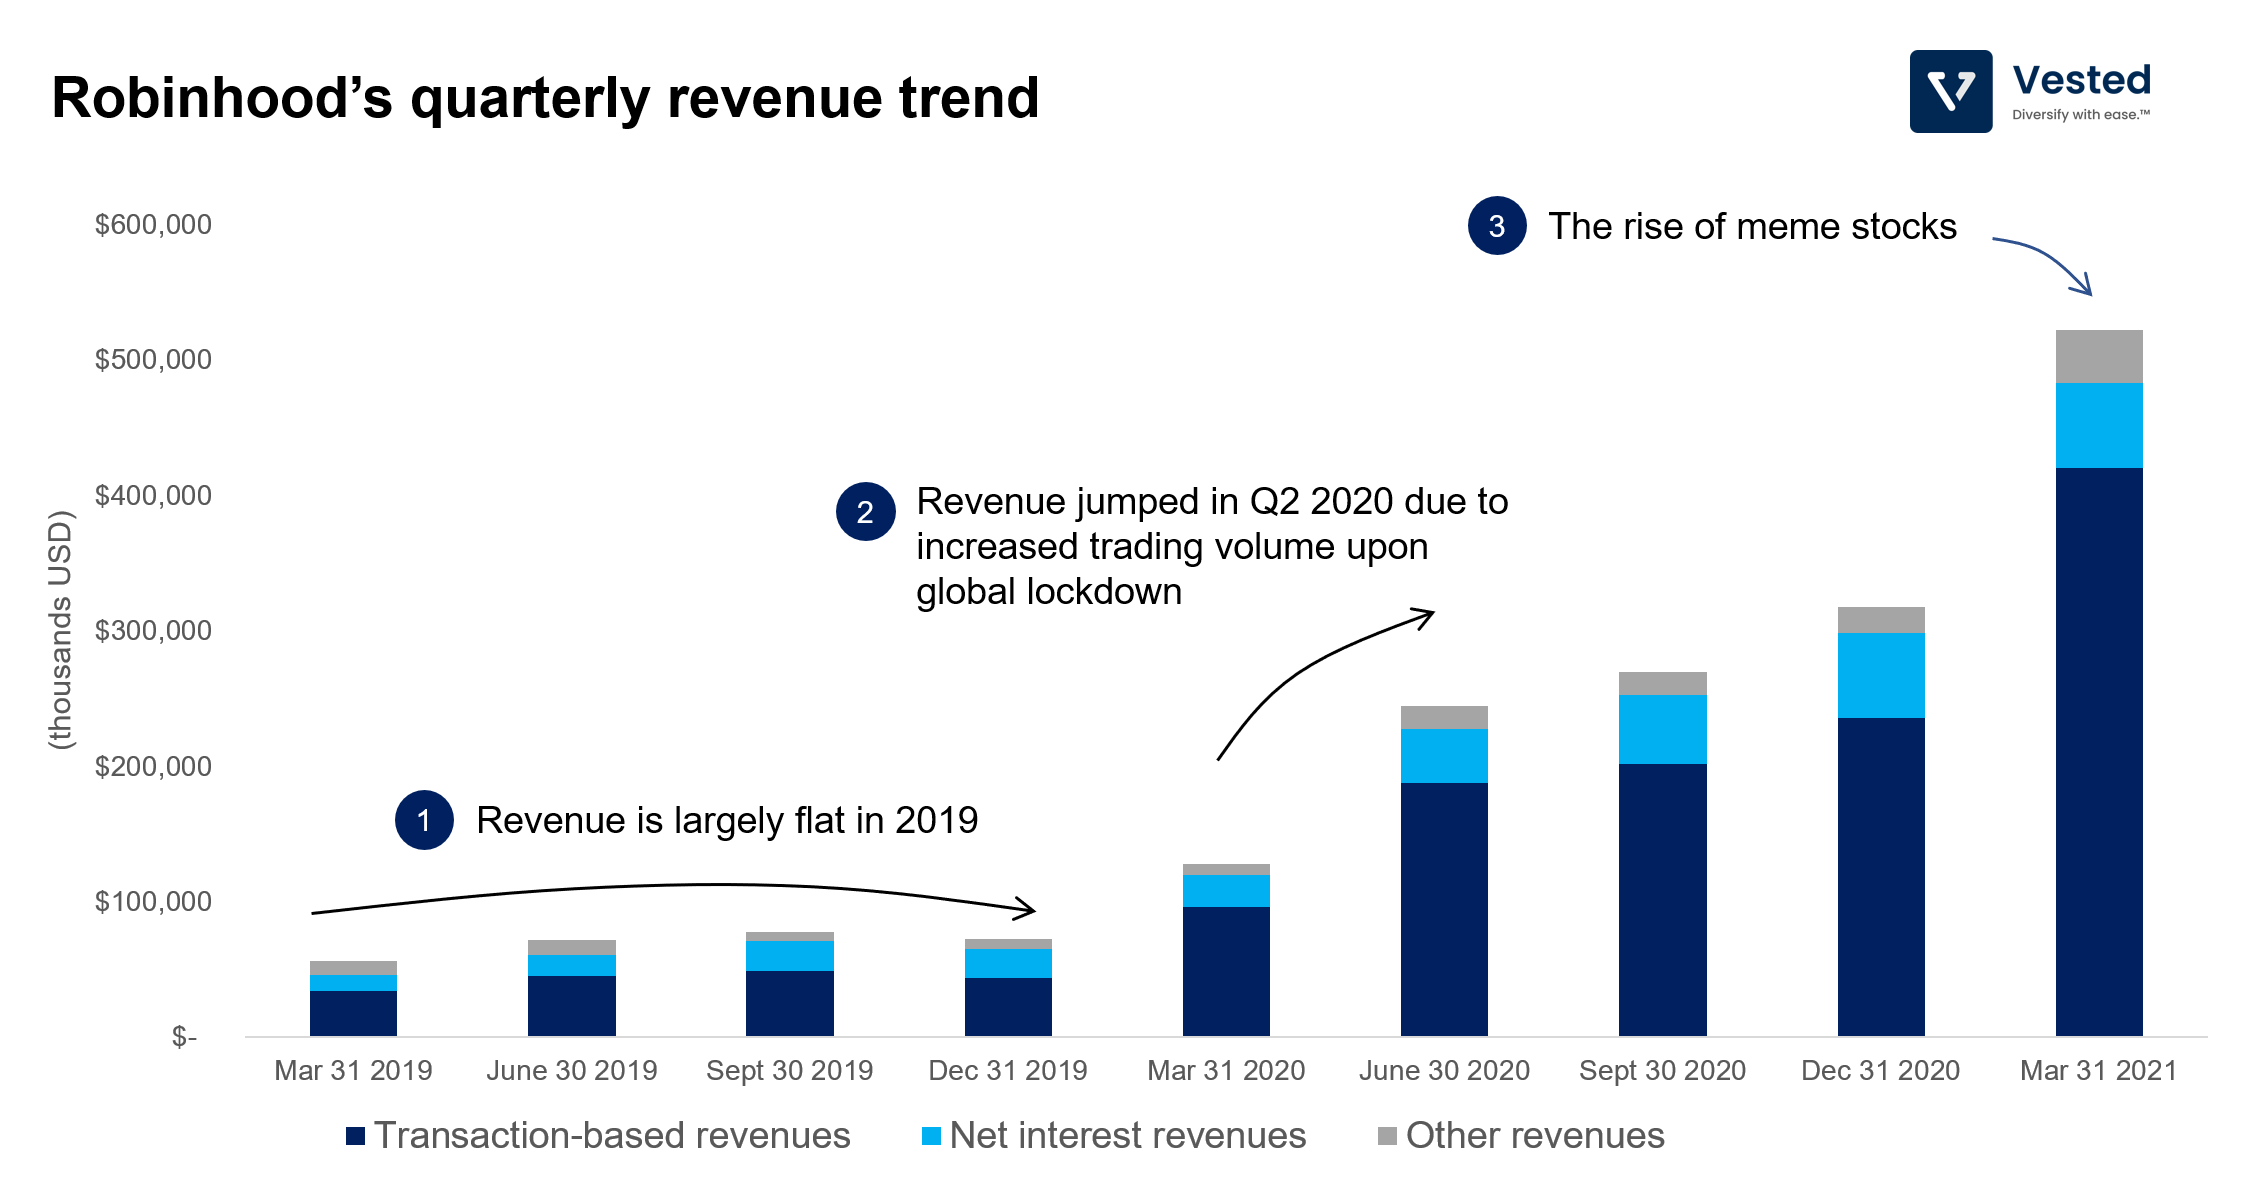
You can see that there are three phases in the revenue trend:
- The first: In 2019, the revenue is largely flat.
- The second: Between Q1 and Q2 2021, revenue went up more than 91%. Increased volatilities and a spike in new user registrations propelled revenue growth.
- The third: The rise of meme stocks in Q1 2021.
Although the company does not break out crypto earnings separately (it’s all baked into transaction-based revenue), a significant source of growth in the second half of 2020 and Q1 2021 was cryptocurrencies (which has since declined). The company made a lot of money from Dogecoin. Approximately 17% of total revenue in Q1 2021 is from crypto, specifically Dogecoin (about â…“ of its total crypto revenue).
What does all this mean? Revenue and earnings will be volatile. The company relies not only on trading activities of equities and options, but also of crypto.
Cohort analysis – are users spending more on Robinhood’s platform?
The challenge with analyzing Robinhood (and Coinbase for that matter) is that these companies are going public at their peak, with a significant tailwind behind them. This makes it hard to understand if the recent growth spurt is a one-time anomaly or something that investors can expect moving forward.
So, rather than looking at top line growth, we shall look at Robinhood’s metrics on a cohort basis. How do different users who signed up contribute towards Robinhood’s business?
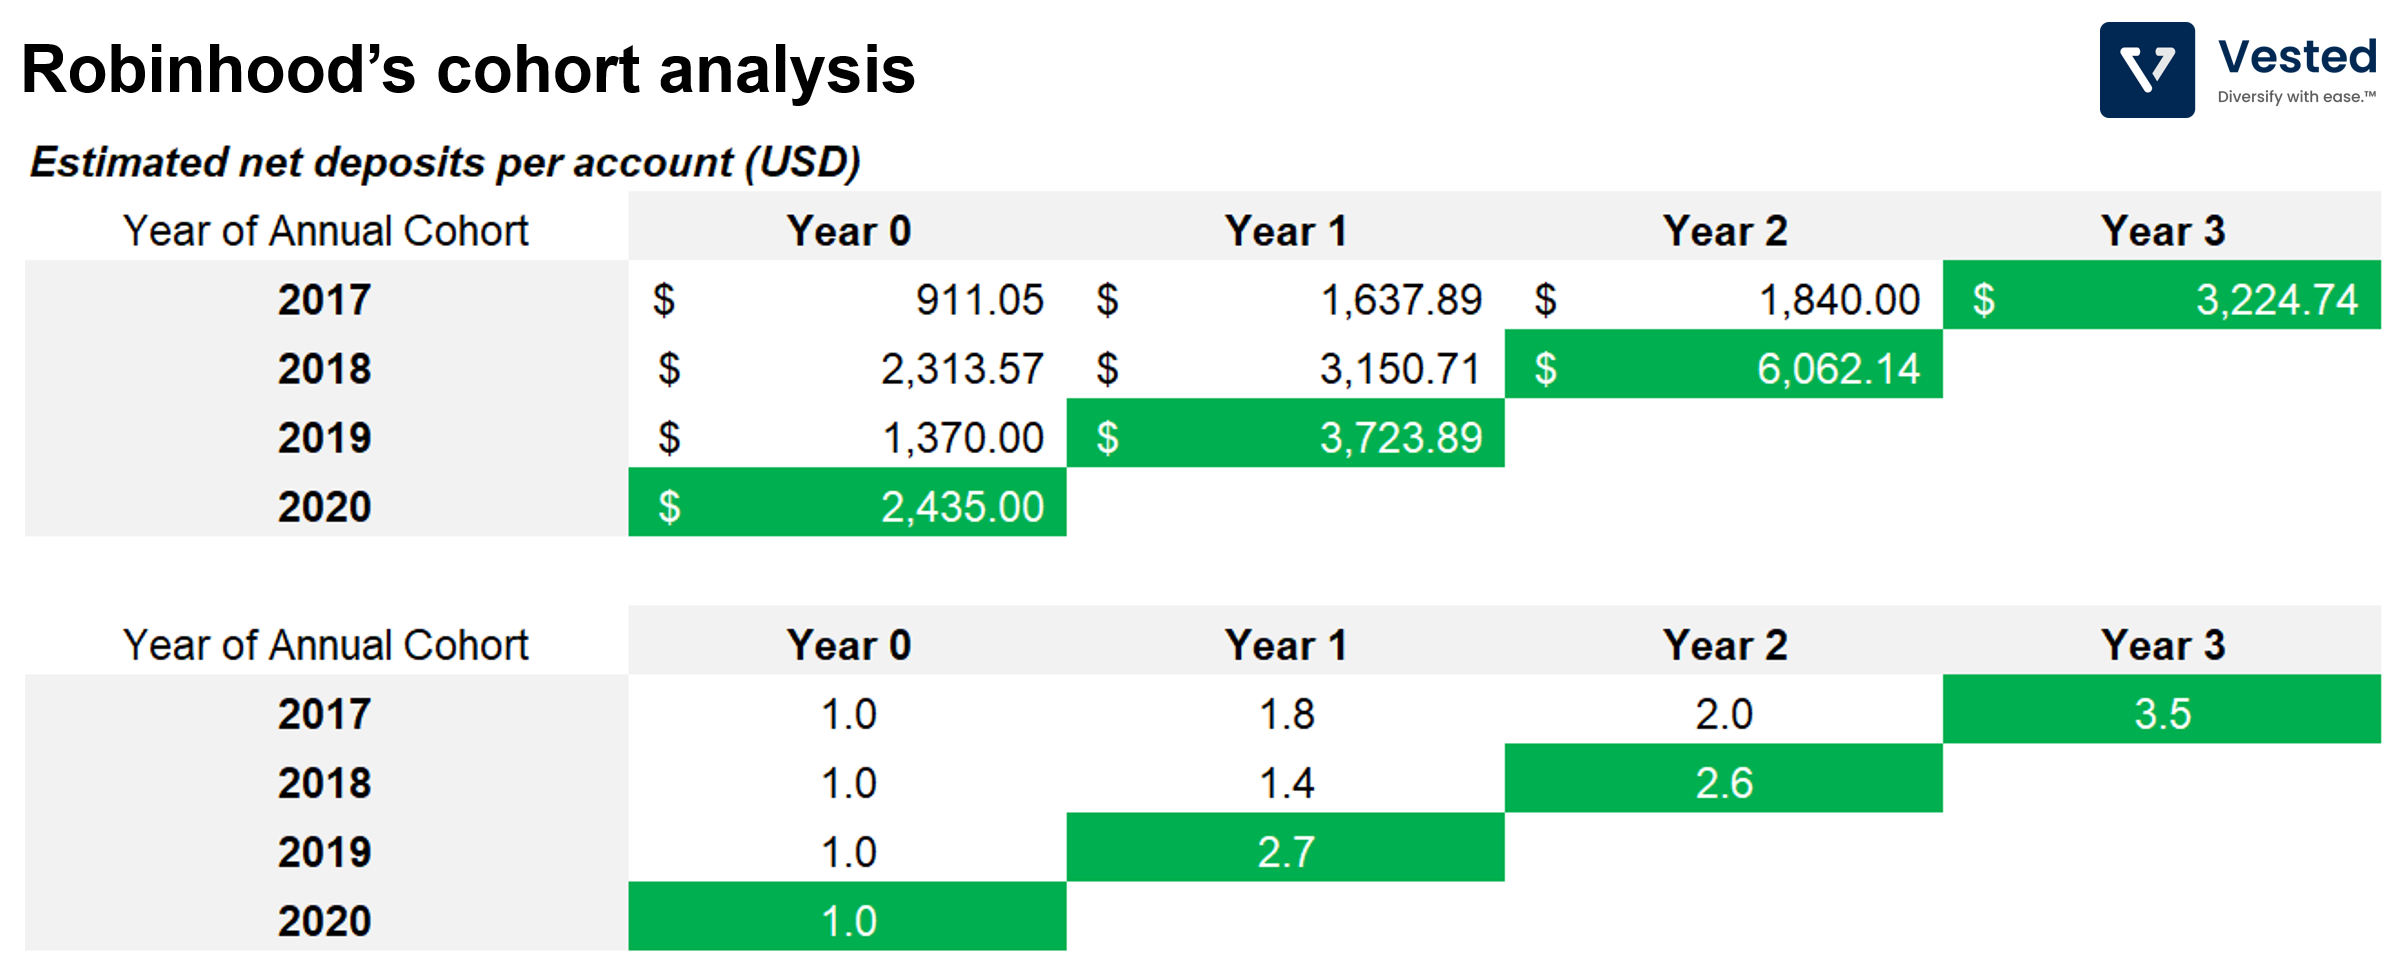
- The net deposit per cohort grows over time. As is with most investing applications, users seem to continue to deposit more funds and increase the size of their investments.
- The average account size is not that high, however (more on this later), and highly variable from year to year. It fluctuates from US$911 in 2017, to US$2,313 in 2018, to US$1,370 in 2019, and then to US$2,435 in 2020. Nevertheless, the net deposit grew over time, growing 2.5 – 3x of the initial year one deposit several years later.
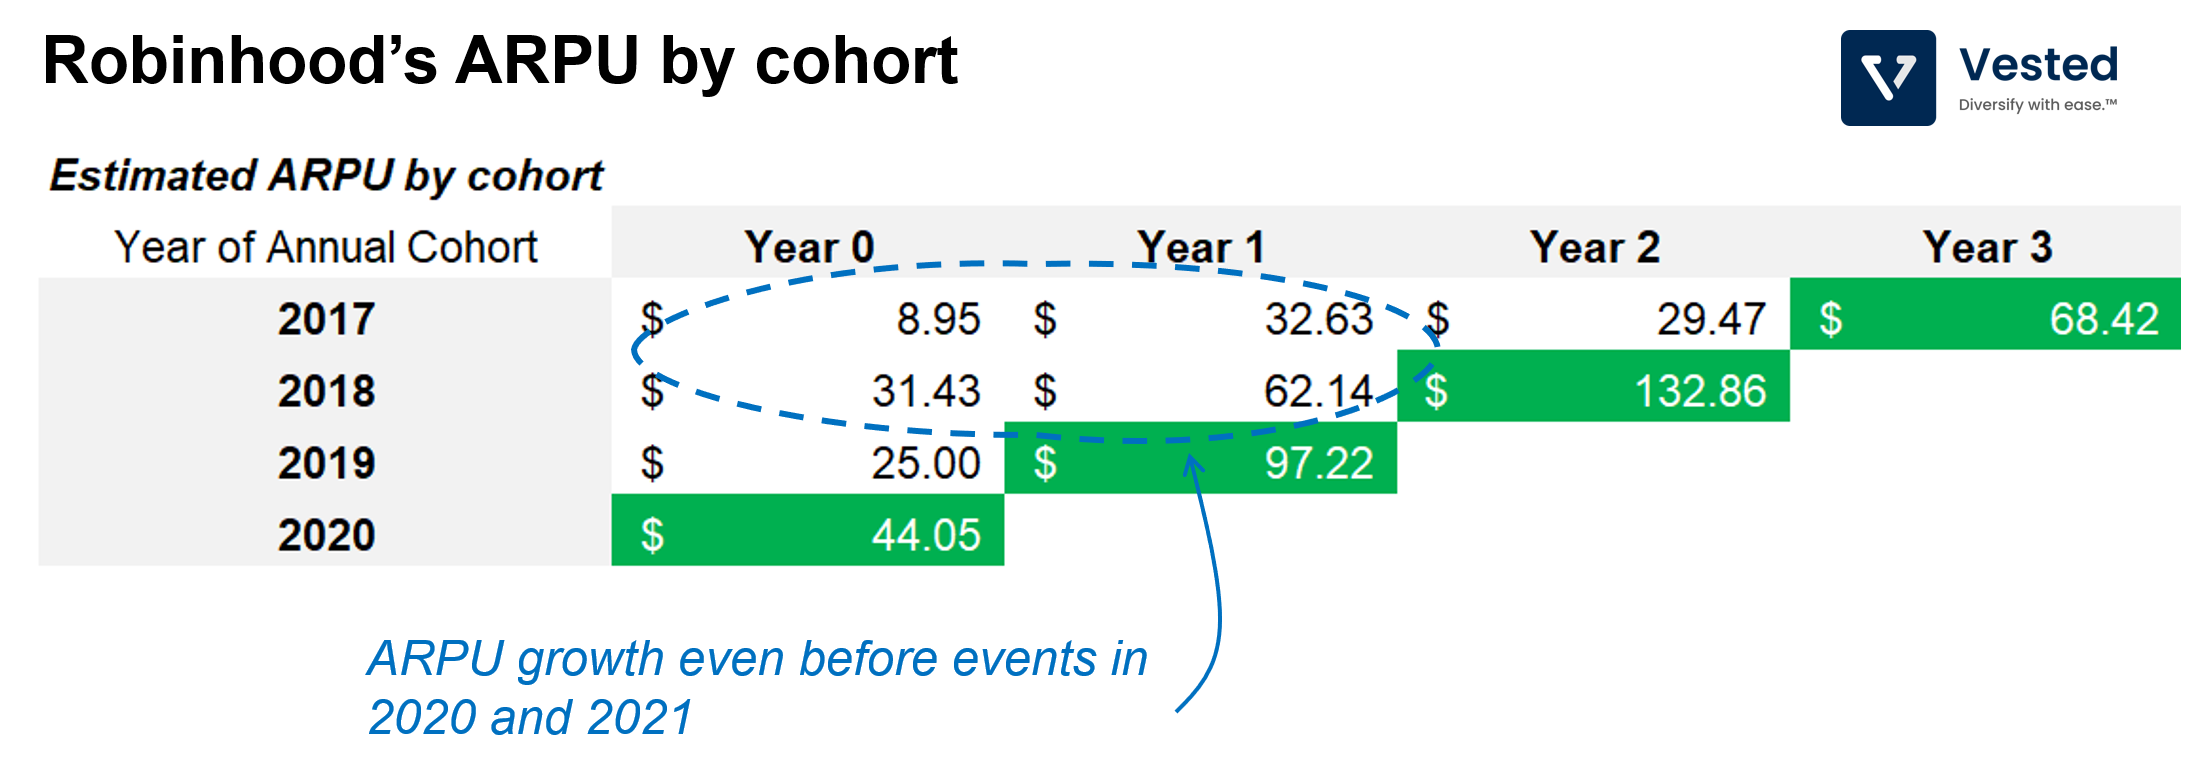
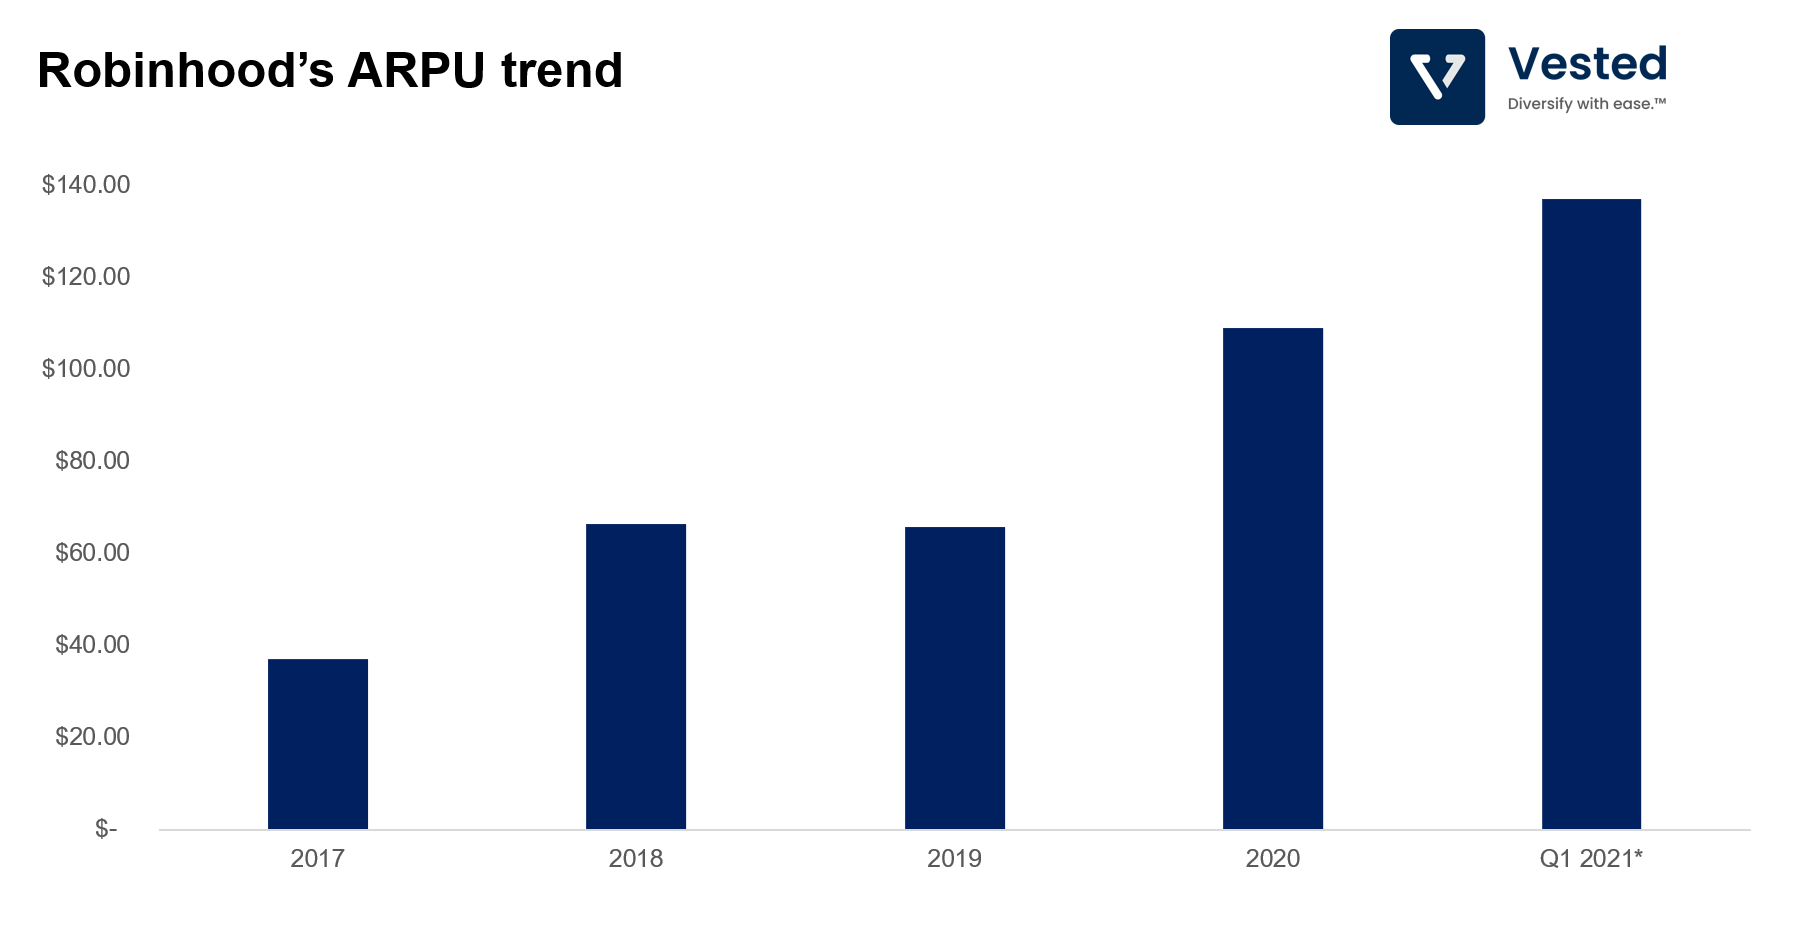
Because Robinhood mainly makes money from PFOF, its revenue will be dictated by the trade size (which is a function of net deposits) and volatility of the market in any given year. As a result, you see high variability in the average revenue per user (ARPU). When we look at the unit economics trend before 2020, we can see the ARPU increase for cohorts 2017 and 2018 (inside dashed circle in Figure 4):
- For the 2017 cohort, the one year ARPU increased by 3.6x, from US$8.95 to US$32.63 (year 2 for the 2017 cohort means that the revenue was generated in 2018).
- For the 2018 cohort, ARPU increased 2x from 2018 to 2019.
These numbers suggest that cohort economics improve over time, even without macro tailwinds in 2020 and 2021. See Figure 4.
Here’s the overall ARPU evolution over time.
Customer acquisition costs
As with any B2C (direct to consumer) business, the cost of acquiring customers (often called customer acquisition cost, or CAC) is one of the most important metrics to be analyzed. CAC does not stay constant. It varies over time. Increasing CAC is an indicator that a business is slowing down.
The company acquires customers primarily through three methods:
- Social media advertising (paid advertising)
- Word of mouth (which is free): A significant driver of recent growth since Robinhood is the de facto retail investing app due to its ease of sign up and use.
- Customer to customer referrals: If a user refers a new user to the platform, both the referring and the referred users get a random stock. Here the company gamifies the referral program by introducing randomness (you don’t know what stock you will get) and by varying the size of the referral (the potential value can be between US$2.50 to US$225, but 98% of the reward is between US$2.50 – US$10 – so really, the average reward is about US$6.25). Variable rewards is core mechanics employed in advertising and in gaming – it can be a powerful tool to activate one’s desire engine.
At any given time, the ratio of spend across the three methods change, depending on macro events. However, due to the recent increase in popularity, efficiency of Robinhood’s social media advertising and its referral program has increased.
As a result:
- Cost to acquire a new funded account declined by more than 60% (from US$53 in fiscal year 2019 to US$20 in fiscal year 2020).
- And thanks to the powerful rise of meme stocks, for the periods ending March 31, 2020 and 2021, the average cost to acquire a new funded account declined by more than 2x (from US$32 to US$15).
Risks
“Show me the incentive and I will show you the outcome.†– Charlie Munger
Since its inception, Robinhood has popularized the zero brokerage model. It’s vision is to democratize finance for all, and in that pursuit, the company has leveraged a business model that is congruent with this vision – by generating much of its revenue from PFOF. Generating revenue from PFOF in itself is not necessarily bad (customers can get price improvement as a result of PFOF). But in the pursuit of maximizing PFOF revenues, Robinhood made product choices that may not be in the best interest of their users.
In order to maximize maximize PFOF revenue, the company has to make trading easily accessible (not just equities, but also options, along with margins product), make a product that is ridiculously easy to transact on (Robinhood’s app is quite barebones – you can’t really use it to do much analysis), get a large retail user base, and generate a very large trading volume to monetize from. The more retail investors use Robinhood, the more order flow the company can drive to the different market makers. But that’s not enough. To further maximize PFOF revenues, the company wants to make trading with margins and in options as easy as possible.
The company’s product is designed to encourage margins and options trading (which are sophisticated instruments that are more appropriate for experienced investors). With these tools, investors can amplify their returns when the market is up, but, when the market goes down, losses are also amplified. And if you don’t have enough margins, you will be forced to sell at the wrong time.
Encouraging novice investors to use these tools without proper education can lead to disastrous results. In June 2020, Alex Kearn, a novice user, committed suicide after incorrectly thinking that he racked up losses amounting to US$730,165. It is only after this tragedy that Robinhood updated its options trading with more safety features and a more expansive knowledge base.
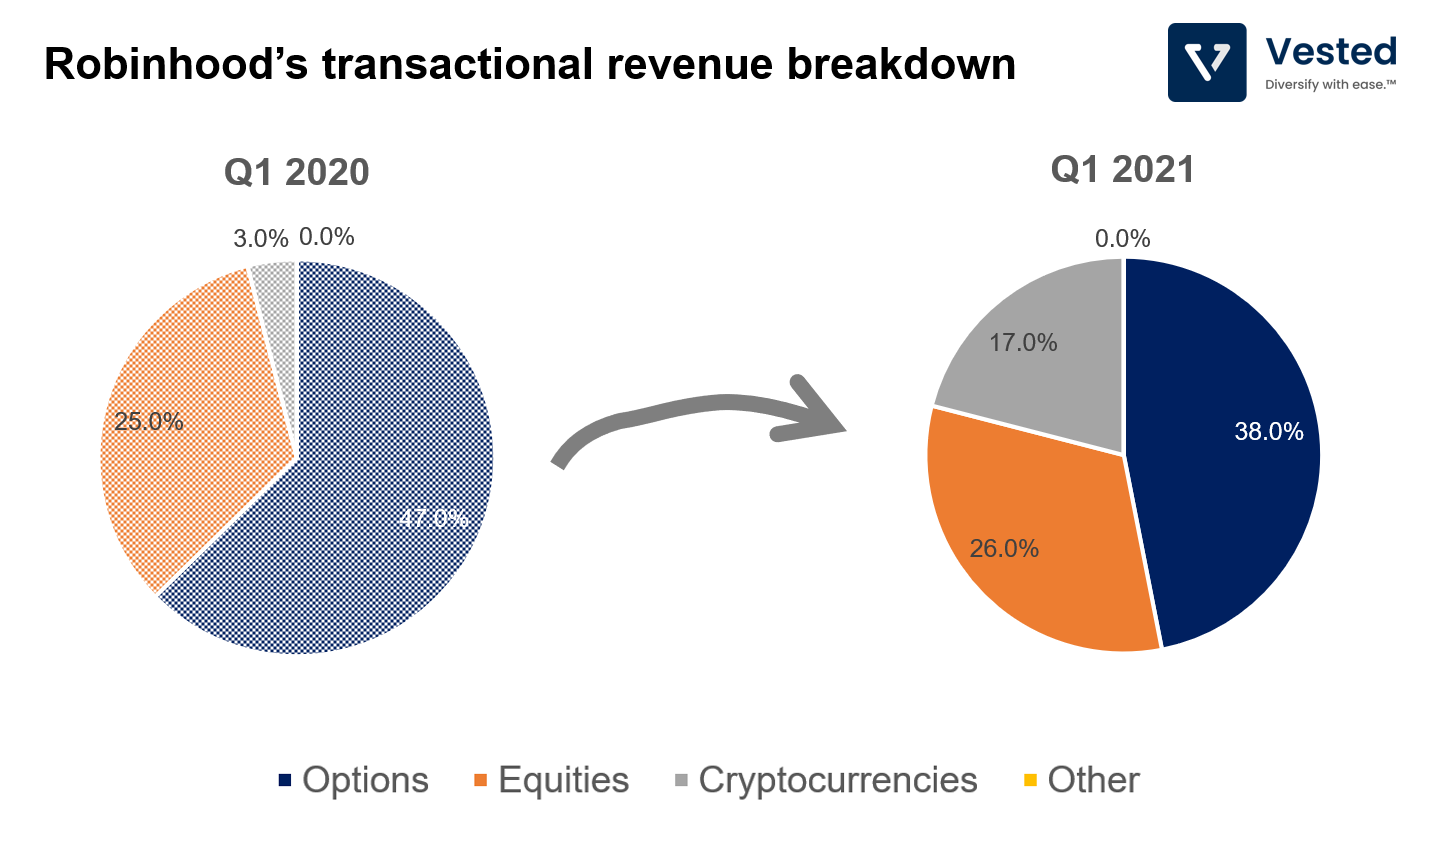
The reason why Robinhood designed a product that encourages margins and options trading is because the bid-ask spread from options is larger than equities. Remember, Robinhood makes money from the percentage of the bid-ask spread. The larger the gap, the more money it makes. Here’s a chart of the transactional revenue breakdown. Revenue derived from options trading is by far the largest contributor of sales (dark blue in Figure 6).
What does this all mean from a risk perspective?
- Negative publicity: Because of the heavy use of margins and options by its users, Ronbinhood was forced to halt trading of some meme stocks earlier this year, as those stocks were extremely volatile, and the DTCC required Robinhood to place an additional US$3 billion collateral to ensure proper settlement of trades. Note, however, that Robinhood was not the only one that had to restrict trades (TD Ameritrade and Interactive Brokers did as well), but because it was bigger, it received the brunt of the negative PR.
- Increased regulatory scrutiny: Both FINRA and SEC recently fined the firm. The risk here goes beyond the fines, however. If there are regulation changes around PFOF, specifically around options trading, then Robinhood’s transaction revenue growth may decline.
What’s next for Robinhood?
Amassing a large retail investor base is the first step. Most of Robinhood’s user base are younger investors that are investing for the first time. With increased pressure on its transaction-based business, the company will want to diversify its revenue streams.
- Increase recurring revenue through Gold subscriptions. The ratio of “Other†revenue (this is where subscription revenue is categorized) as percentage of total revenue went up from 6.2% in Q1 2020 to 7.5% in Q1 2021. Product changes are likely required to meaningfully change this ratio, however, as the core value proposition for the Gold subscription is currently targeted towards the more frequent DIY investors.
- Add more banking features to generate additional revenue from debit cards. Robinhood already has a cash management program and a co-branded debit card with Mastercard. Additional banking features may help generate more meaningful revenue from this product line.
- Get into the retirement management service? This is probably the fastest way to increase AUC and average account size per user. We mentioned above that the deposit size per user is less than US$2,000 in the first year (Figure 3). This is 100x smaller than the average account size of Charles Schwab clients (~US$200,000 per client), although unlike Robinhood, Charles Schwab offers not only brokerage services, but also bank accounts and (more importantly) corporate retirement accounts.
The three items outlined above are pertinent if Robinhood is serious about becoming an investment solution. Currently, its strategy is focused on maximizing payment for order flow revenues, optimizing for maximum number of trades (giving everyone access to options and margins, oversimplification of trading mechanics, etc). While this strategy has worked to get Robinhood to where it is today, it is counter to its mission (and is why Robinhood is getting such fierce blowback from the public and the media, in addition to increased regulatory scrutiny).


