Skip to content


Vested’s mission is to empower you to invest and help you be a better investor. As such, we are very excited to announce the rollout of our revamped stock details page.
The new design is built around three core philosophies:
- Ease of use: Present rich information in an easy to digest manner.
- Useful data: In addition to advanced charting, provide fundamental data and key ratios to help you make better decisions.
- Comparability: Provide tools to make it easier for you to compare different stocks, as investing is never carried out in a vacuum – you always have to consider other opportunities before making investment decisions.
These changes are currently live on the web platform, and an update will be available on Android and iOS in the coming weeks.
Overview
The Overview tab has been revamped to make it easier to read at a glance. We’ve also added information regarding sector, industry and Beta.
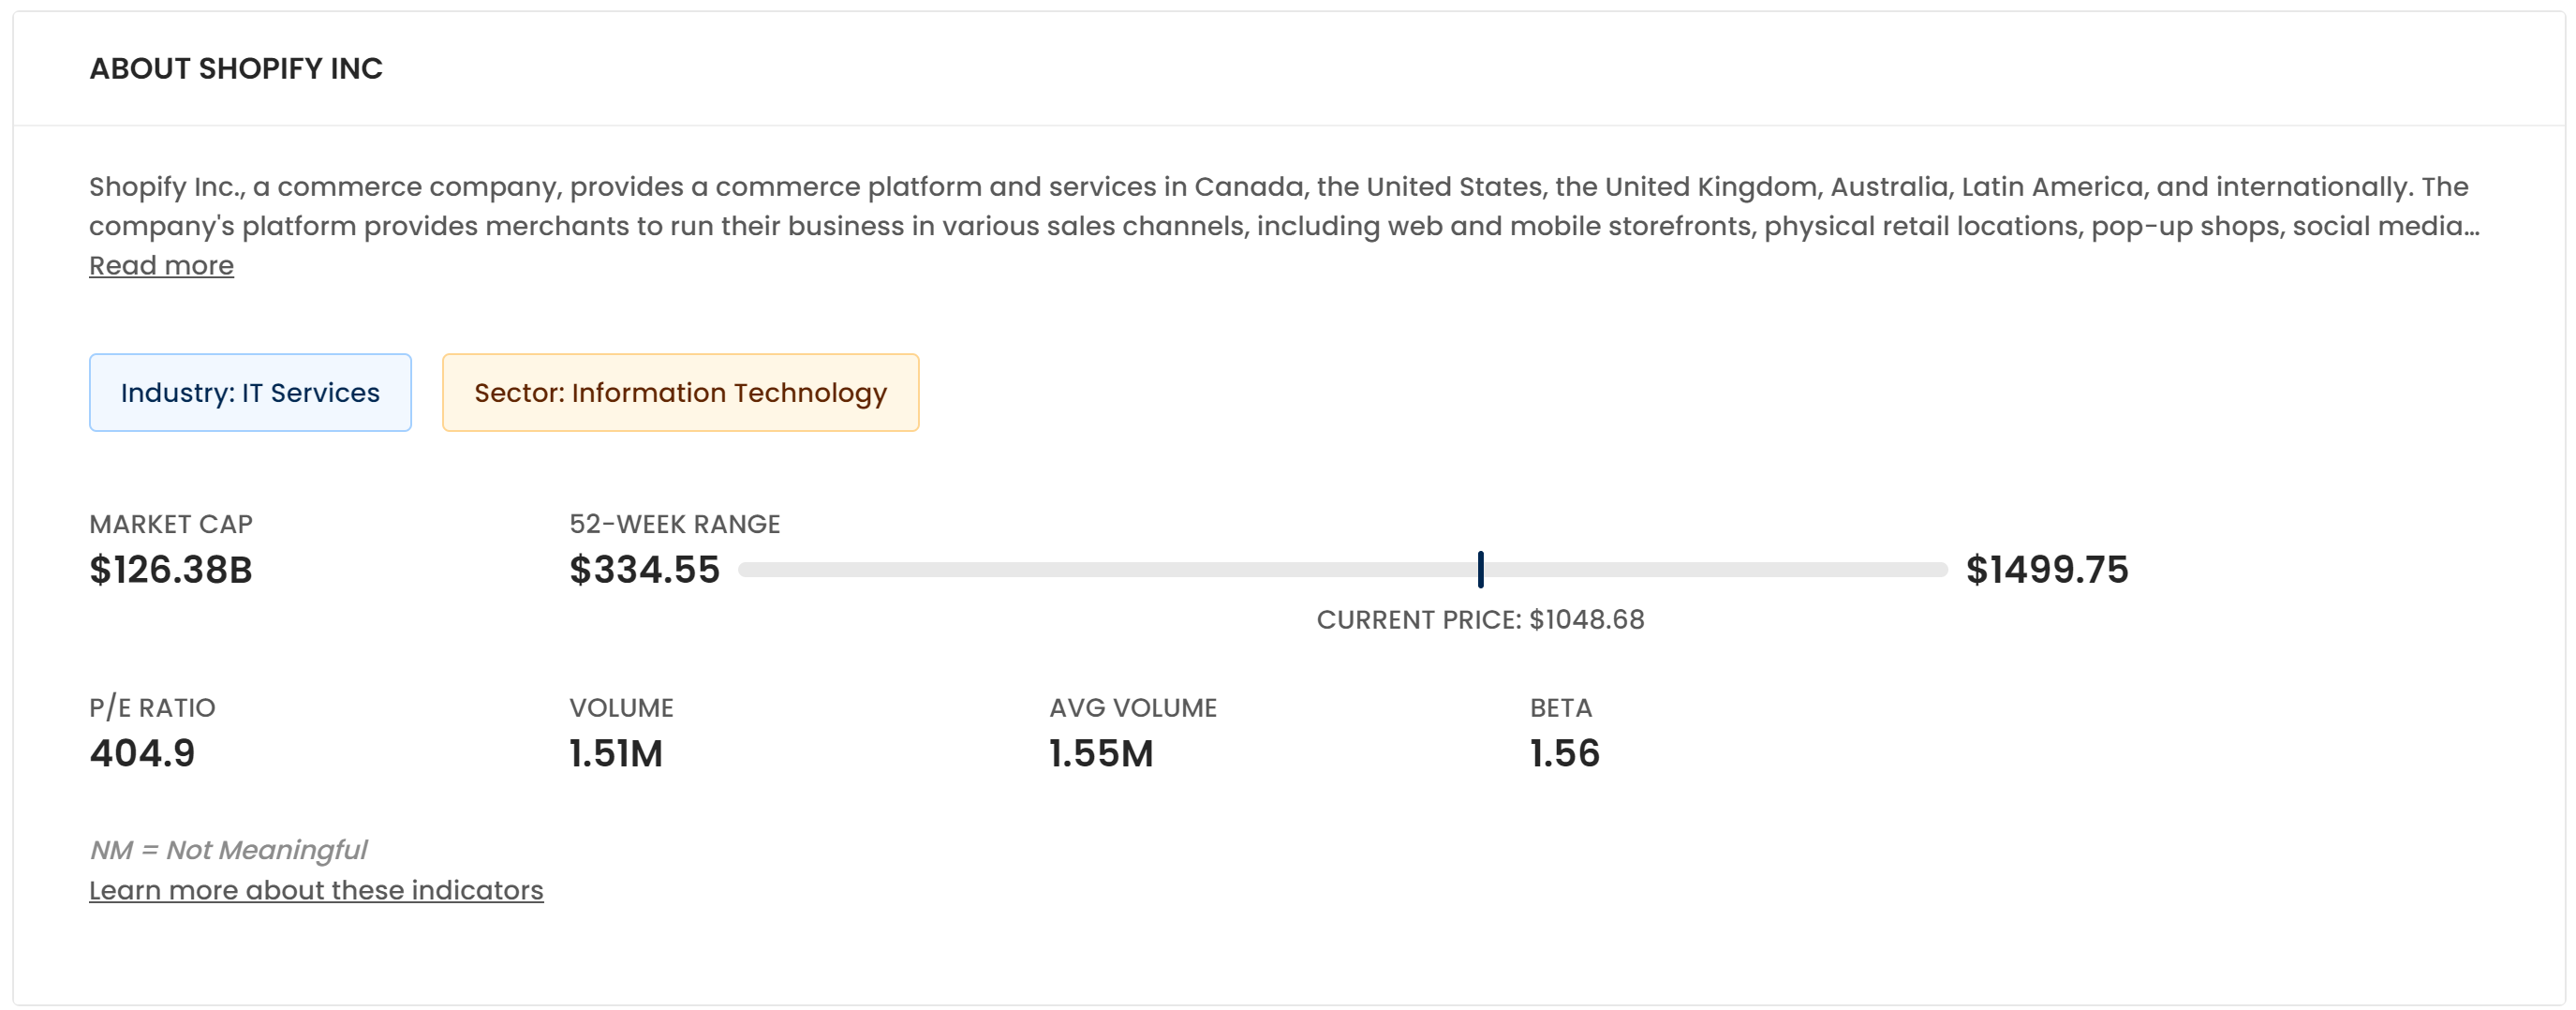
Note: Beta measures the expected move of a stock relative to movements of the overall market. The market (S&P 500) has a beta of 1.0. If a stock has a Beta greater (or lower) than 1.0, it suggests that the stock is more (or less) volatile than the broader market.
Returns
The Returns tab contains a table summarizing the returns over various time periods. In the animation below, we showcase the returns of Shopify over various timeframes. In addition, you can:
- Compare the stock’s returns against the returns of its sector and the broader market (S&P 500).
- Compare with another stock. In this example, we show the returns of Shopify vs. Amazon.
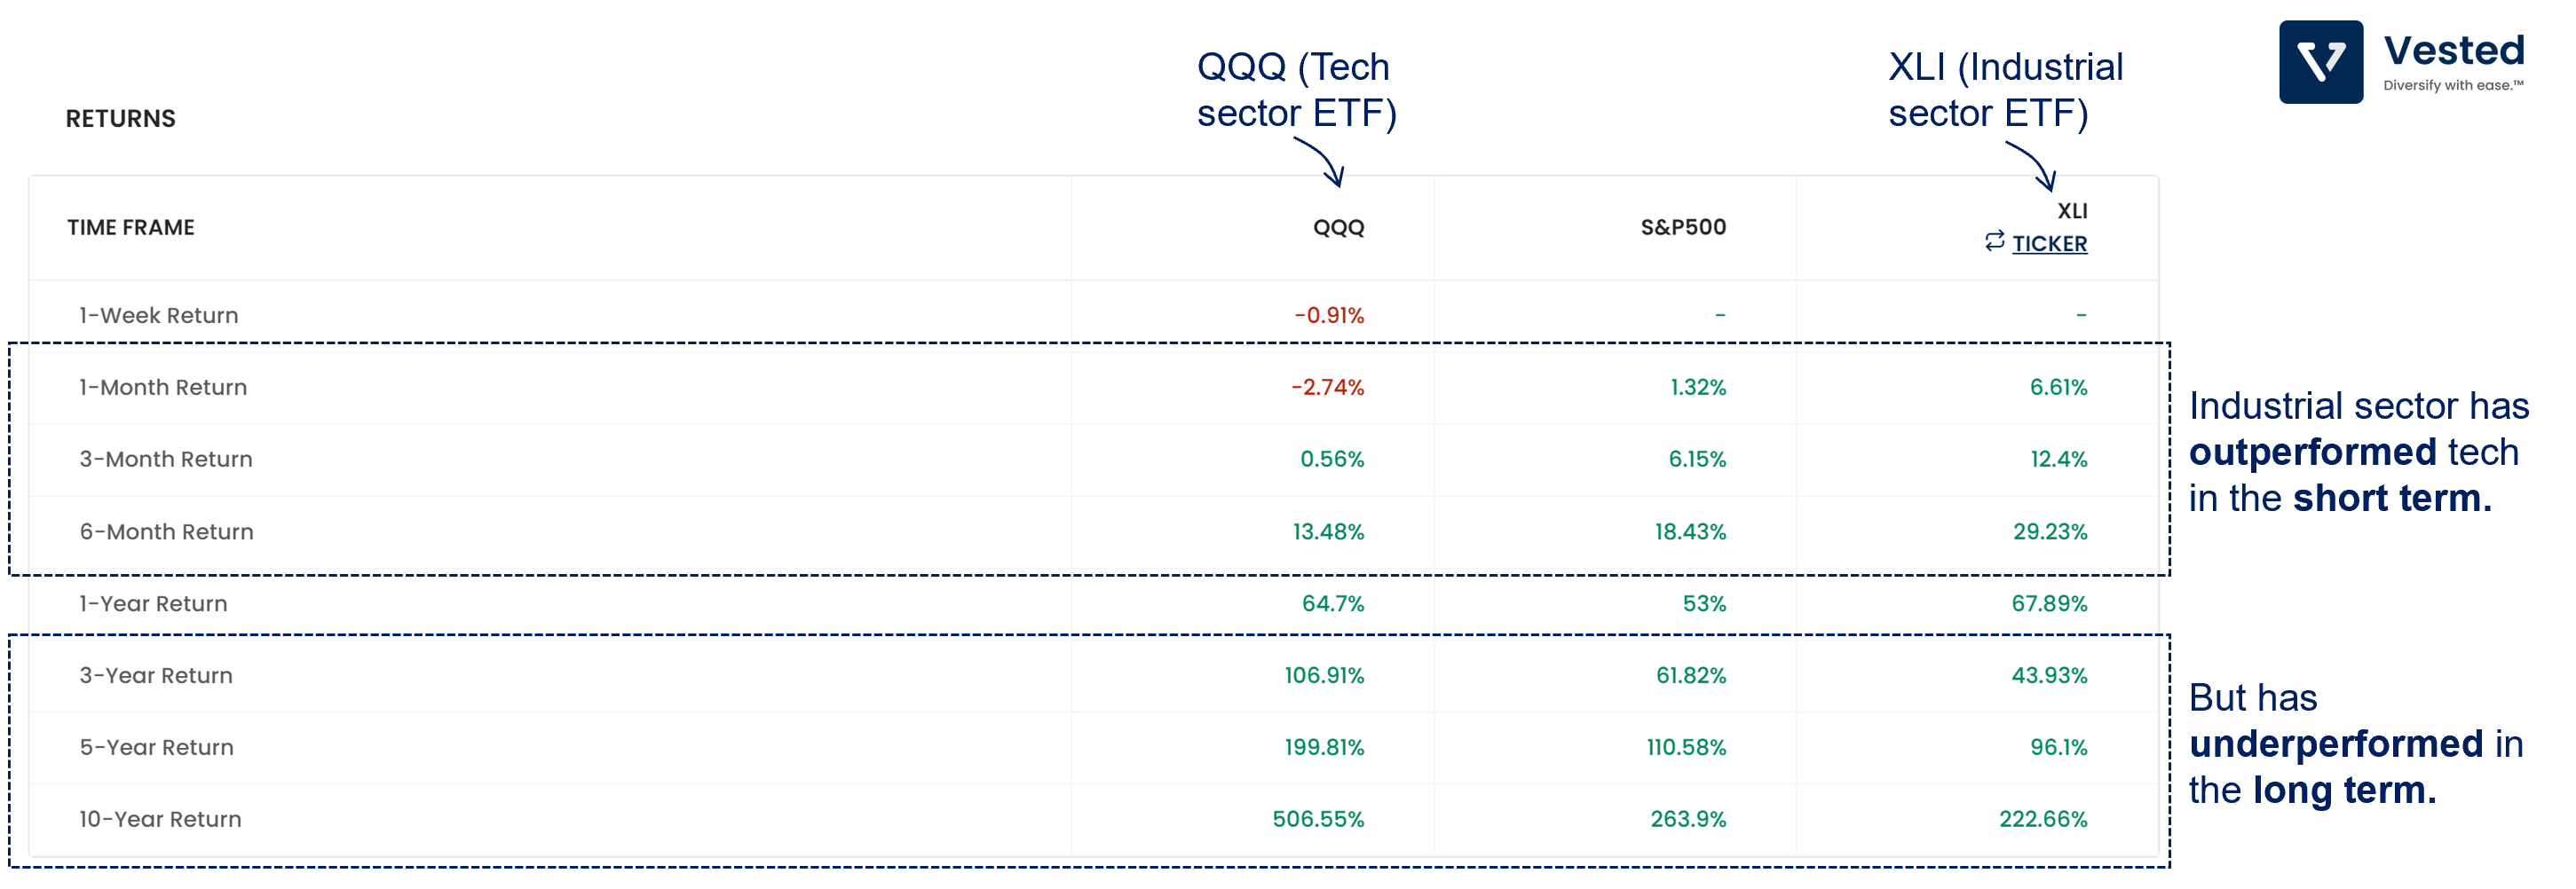
Another cool thing you can do with this feature is compare two ETFs that represent different sectors and easily look at rotations happening in the stock market.
In the following image, you can see an example comparing Tech (QQQ) and Industrial (XLI). With the economic recovery underway and US Treasury yield rising, we can see that the Industrial sector outperformed the Tech sector in the short term (but underperformed in the long term).
Fundamental Data
The Fundamental Data tab provides quarterly/annual financial information in absolute dollar and in percentage.
Key Ratios
The Key Ratios tab contains financial ratios that give you information across five key areas:
- Liquidity
- Asset Efficiency
- Liabilities
- Valuation
- Investor Sentiment
You can compare the ratios of the stock you are looking at with its peer group and another company of your choosing. To help you easily compare the values, the best value for each ratio (each row) is highlighted in blue.
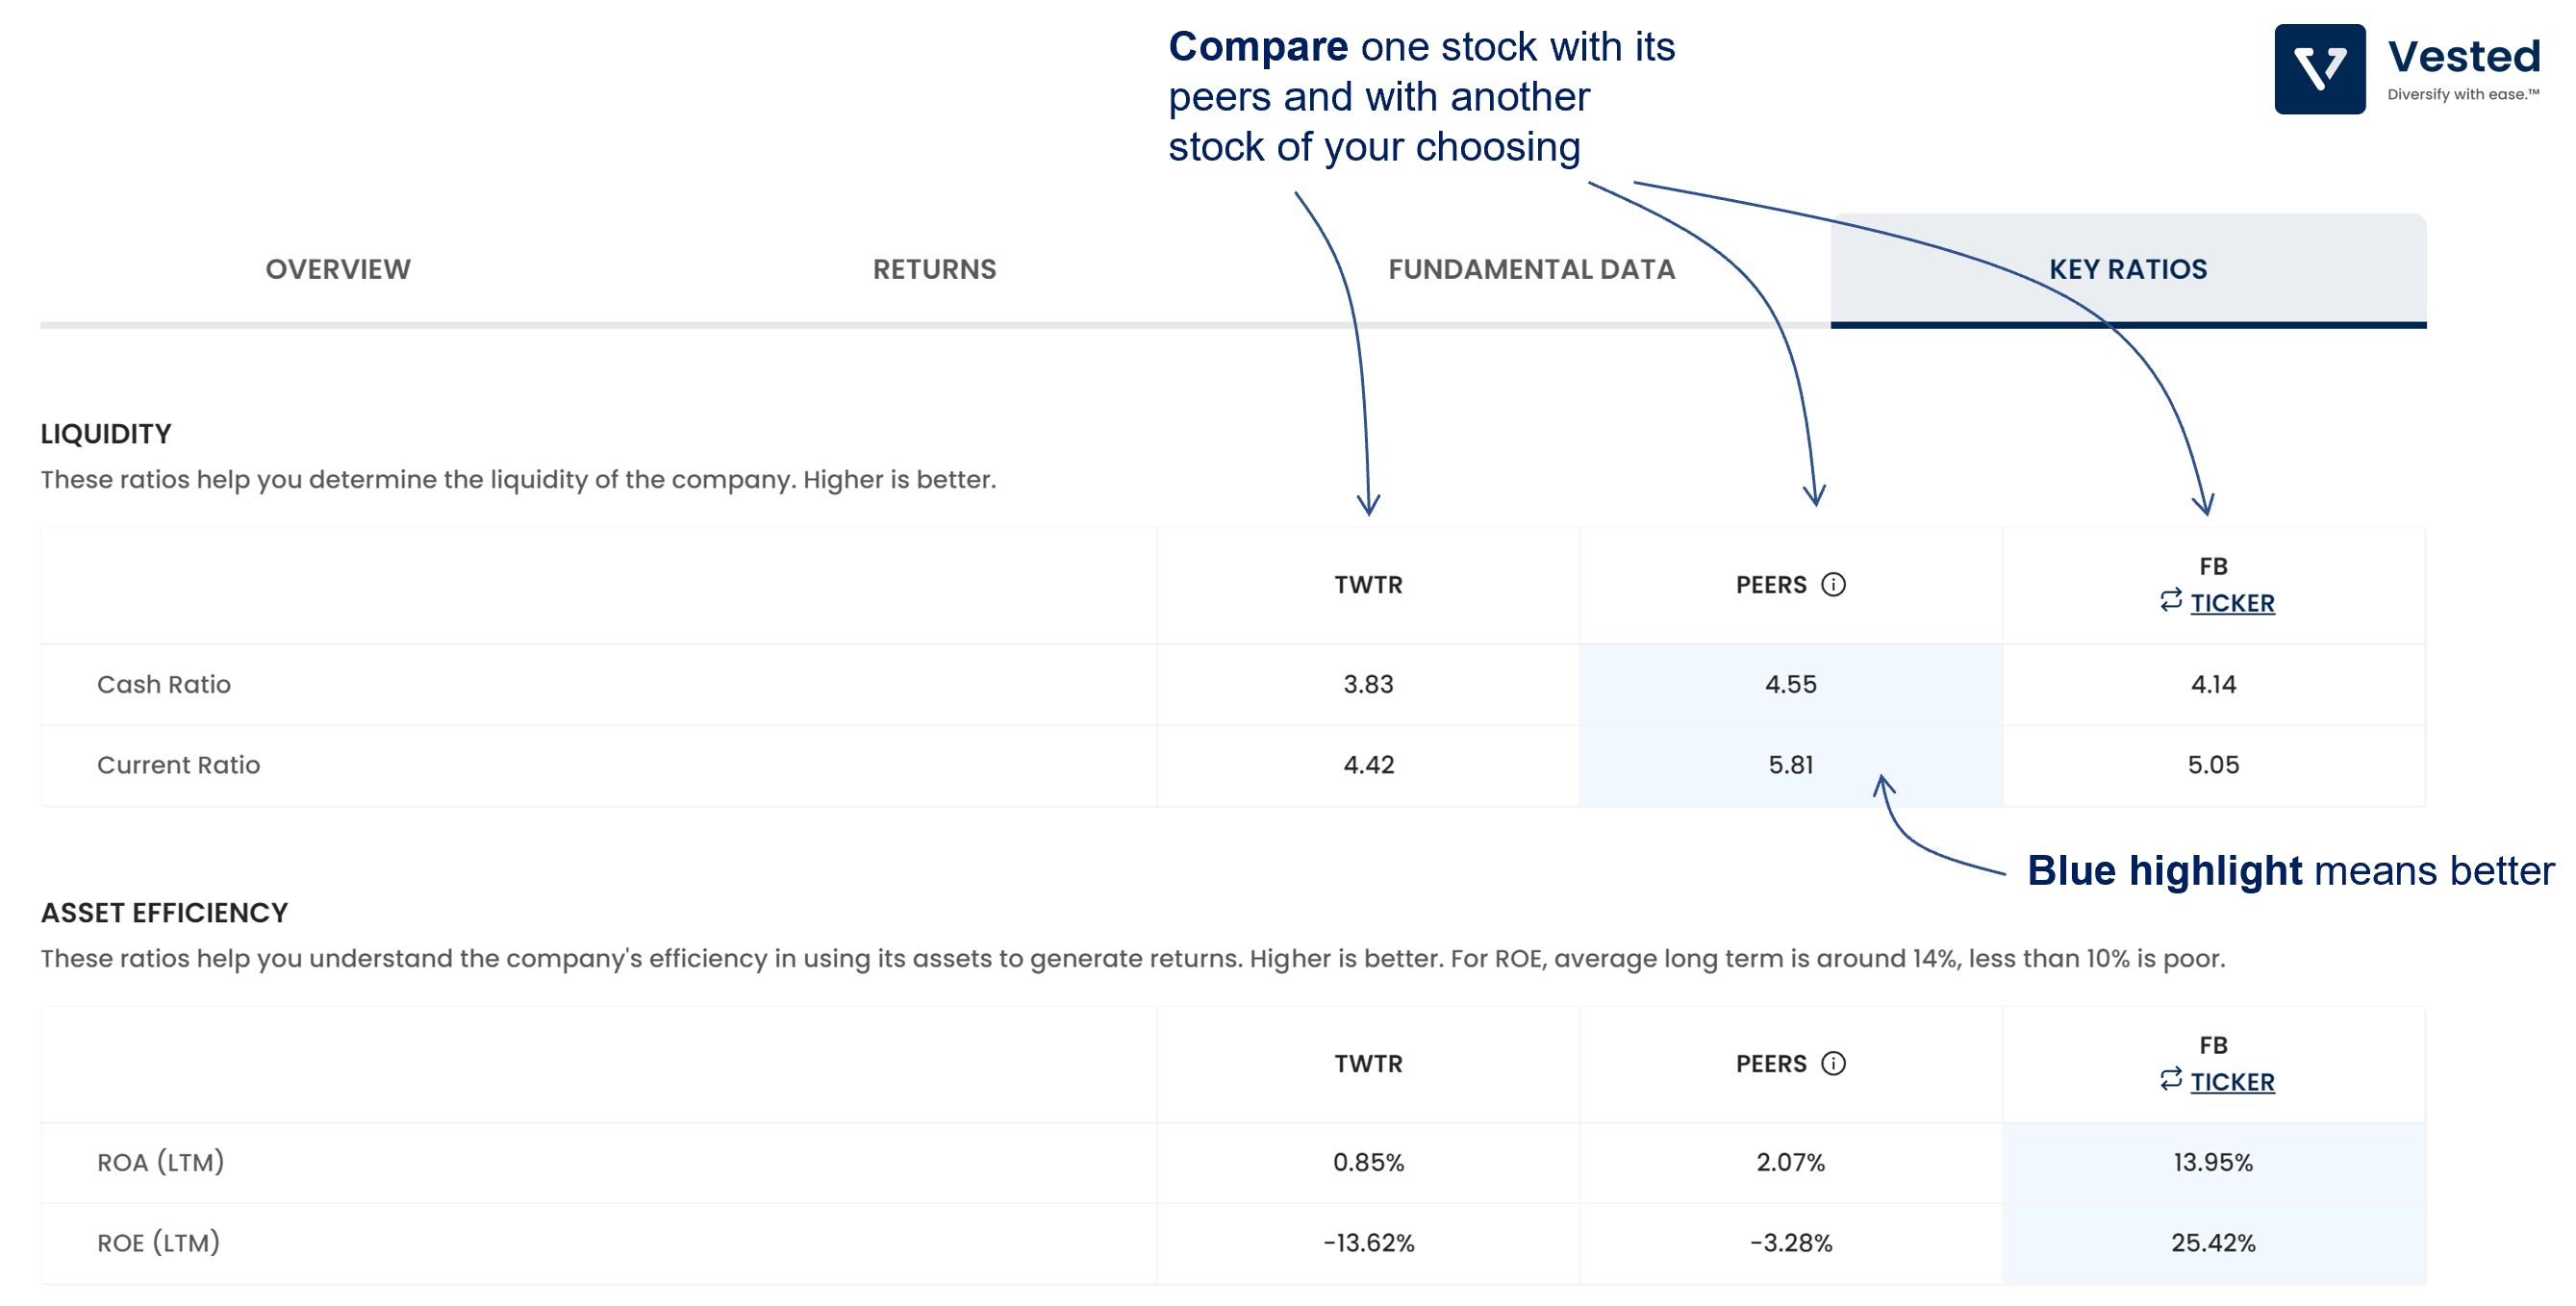
Click on the (i) to see who the peers are.