 Skip to content


Tesla’s earnings and the continued shift to EV and renewable energy
The continued shift towards EV and renewable energy has been a boon for Tesla. The company reported revenue of US$10.4 billion, up 74% year-over-year. Here are four key takeaways:
- Tesla is expanding by replacing internal combustion engine (ICE) cars. According to the company, in the past 2 years, 98% of new Tesla buyers in the US traded in ICE cars for Teslas. This trend appears to have continued into 2021. In Q1 2021, the company saw the strongest order rate in its history.
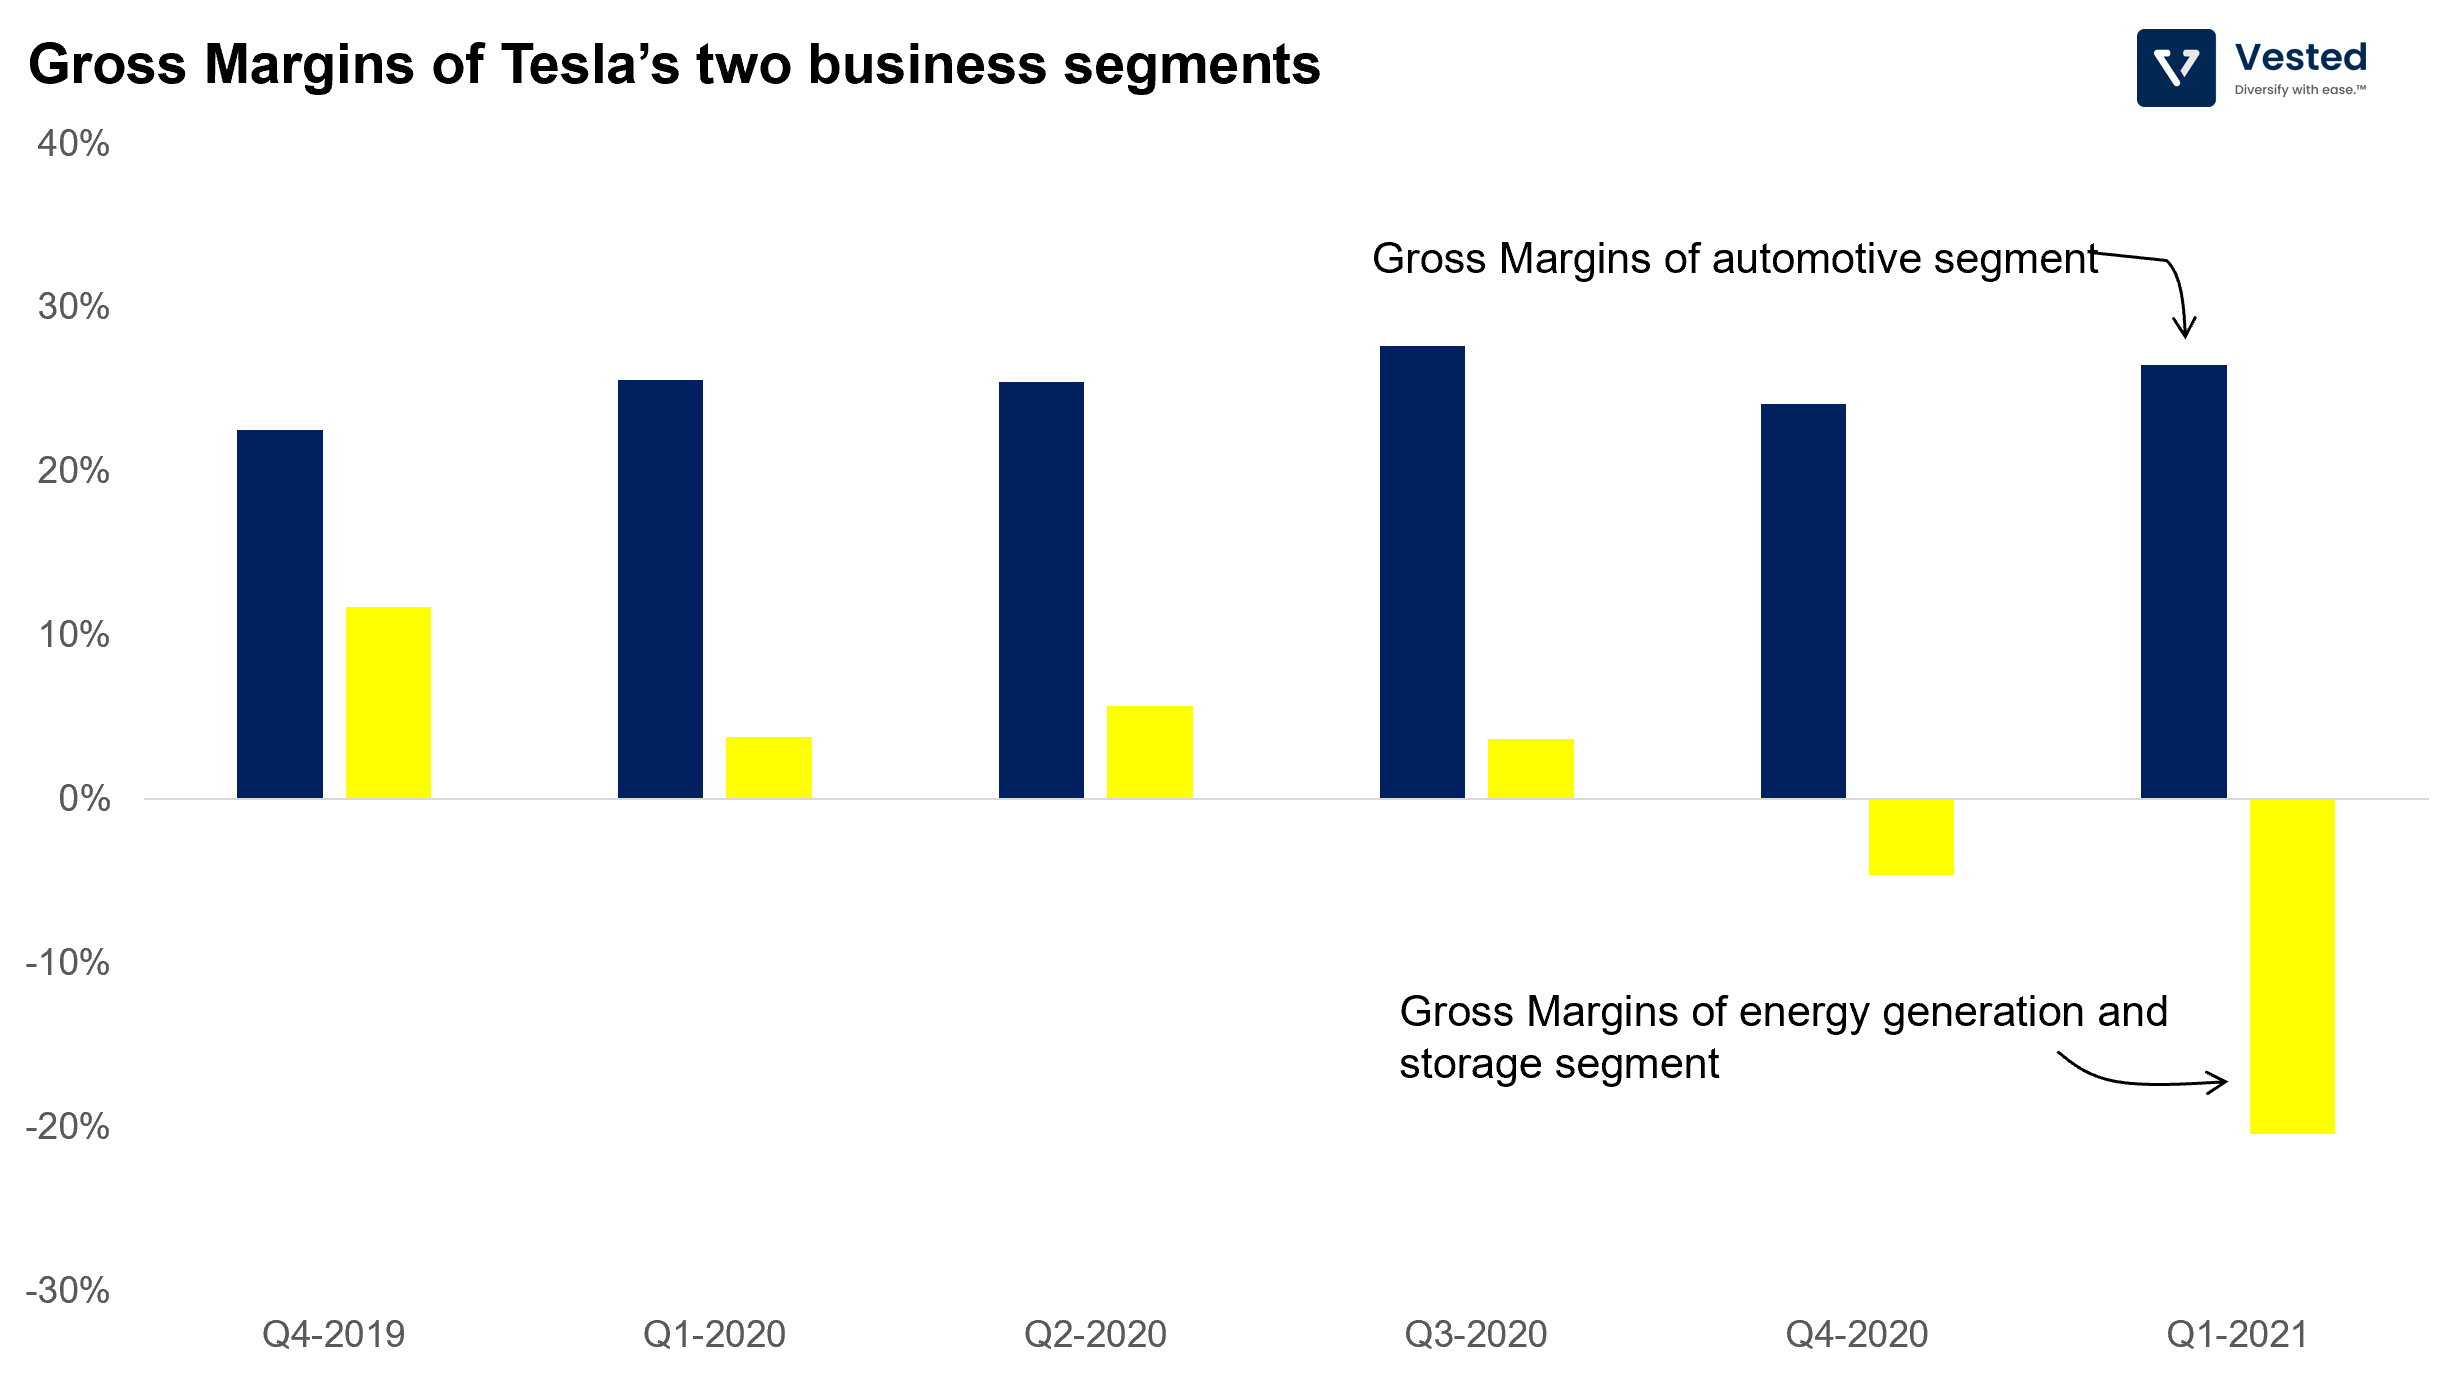
- In total, the company made US$9 billion from selling/servicing/leasing cars and US$518 million in regulatory credits. Regulatory credits is revenue that the company generates from selling carbon credits to other automakers who do not produce enough EVs to meet the standard. This regulatory credit revenue is pure profit for Tesla, but as other companies sell more EVs, this revenue will decline, and so will the company’s profitability. In Q1, the company reported automotive margins of 26%, but if you exclude the regulatory credit, this number is only 21%.
- Powered by increased demand in its solar panel and battery pack, Tesla’s energy generation and storage segment grew 69% year-over-year. It is still massively unprofitable, however. Musk said that Tesla has underestimated the complexities of installing their solar roof products, leading to costs overrunning. As a result, in Q1 2021, the more Tesla solar roof products sold, the more money the company lost (Figure 1). The company recently raised prices in order to mitigate this problem, which angered customers. Note, however, that energy generation and the storage segment is only 5% of the company’s total revenue – still a small contributor to the top line.
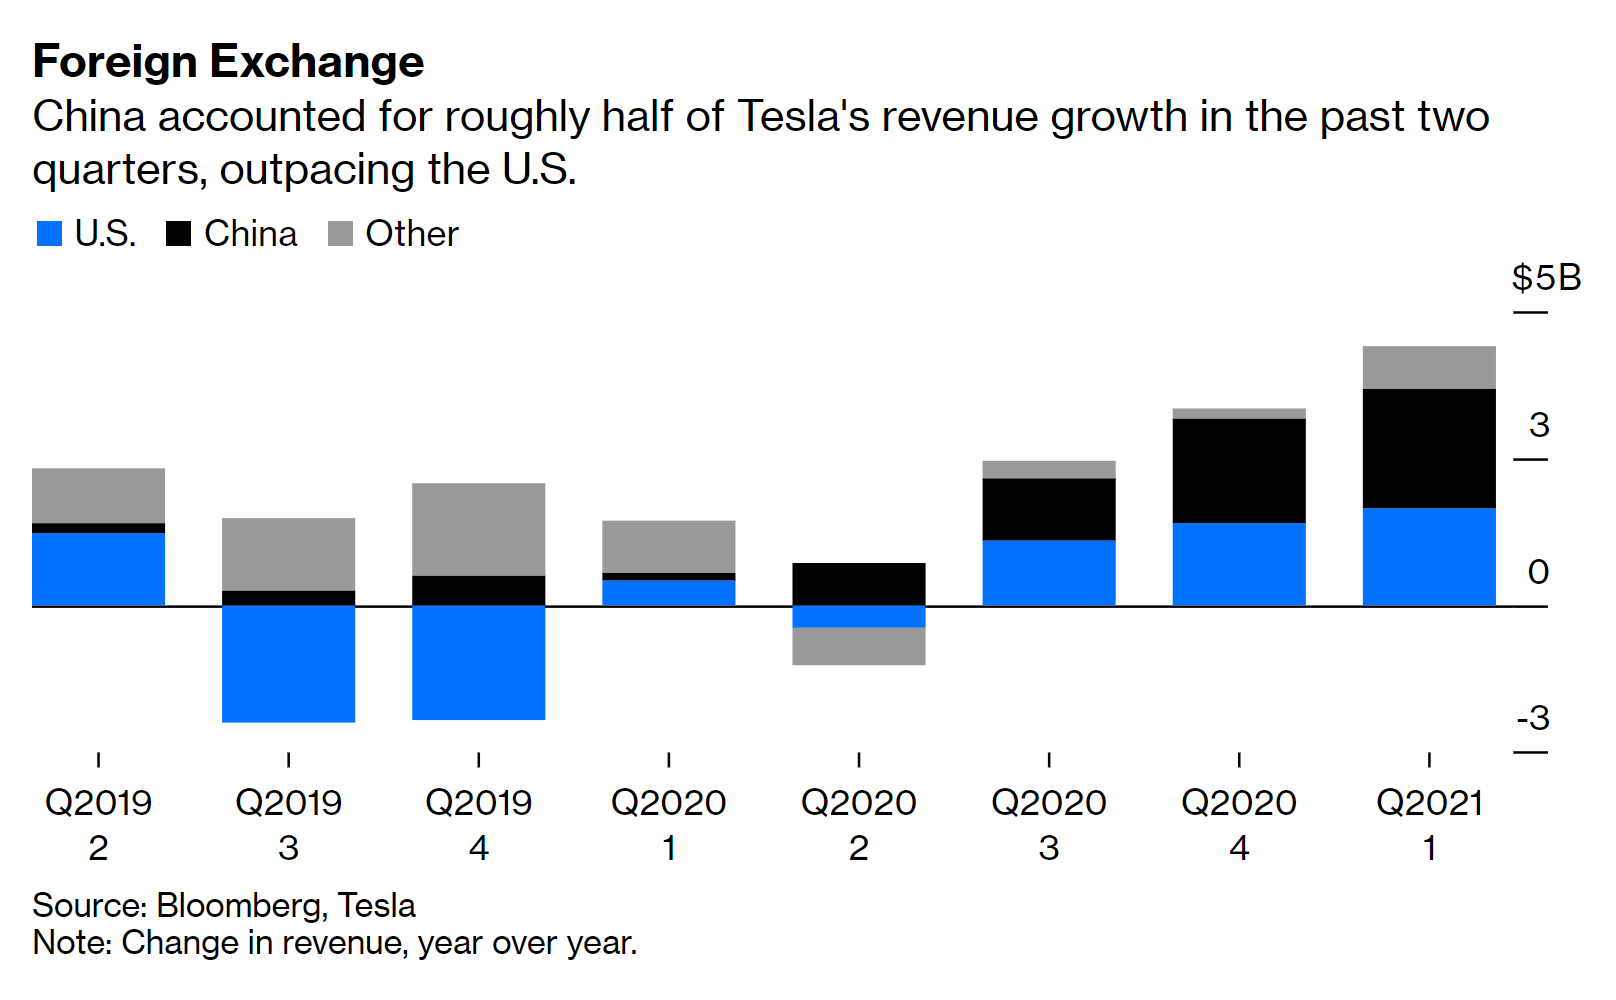
- China has become very important for Tesla. Not only is China home to one of Tesla’s largest and lowest-cost manufacturing centers, it is also the primary driver of Tesla’s recent growth (black bar in Figure 2). About half of Tesla’s revenue growth in Q2 2021 comes from China. This is why Tesla is quicker to issue a public apology in China (especially considering China’s track record of being tough with companies that do not play nice with regulators), while in the US, the company uses a more adversarial approach against regulators.
Continued growth of ecommerce continues to be a boon for the companies in the ecosystem
It’s no secret that the global adoption of ecommerce accelerated through the pandemic years, and that trend has continued through the first three months of 2021. What is surprising, however, is the level of outperformance of companies in the ecommerce value chain – more than even the very optimistic views of Wall Street.
Companies that enable businesses to sell online: Shopify and Amazon
Both Shopify and Amazon outperformed analysts’ expectations by wide margins.
Shopify’s Q1 2021 Earnings
For the first three months of 2021, Shopify posted US$988.6 million in revenue (a 110% increase year-over-year), beating consensus estimates of revenue by 14.5%.
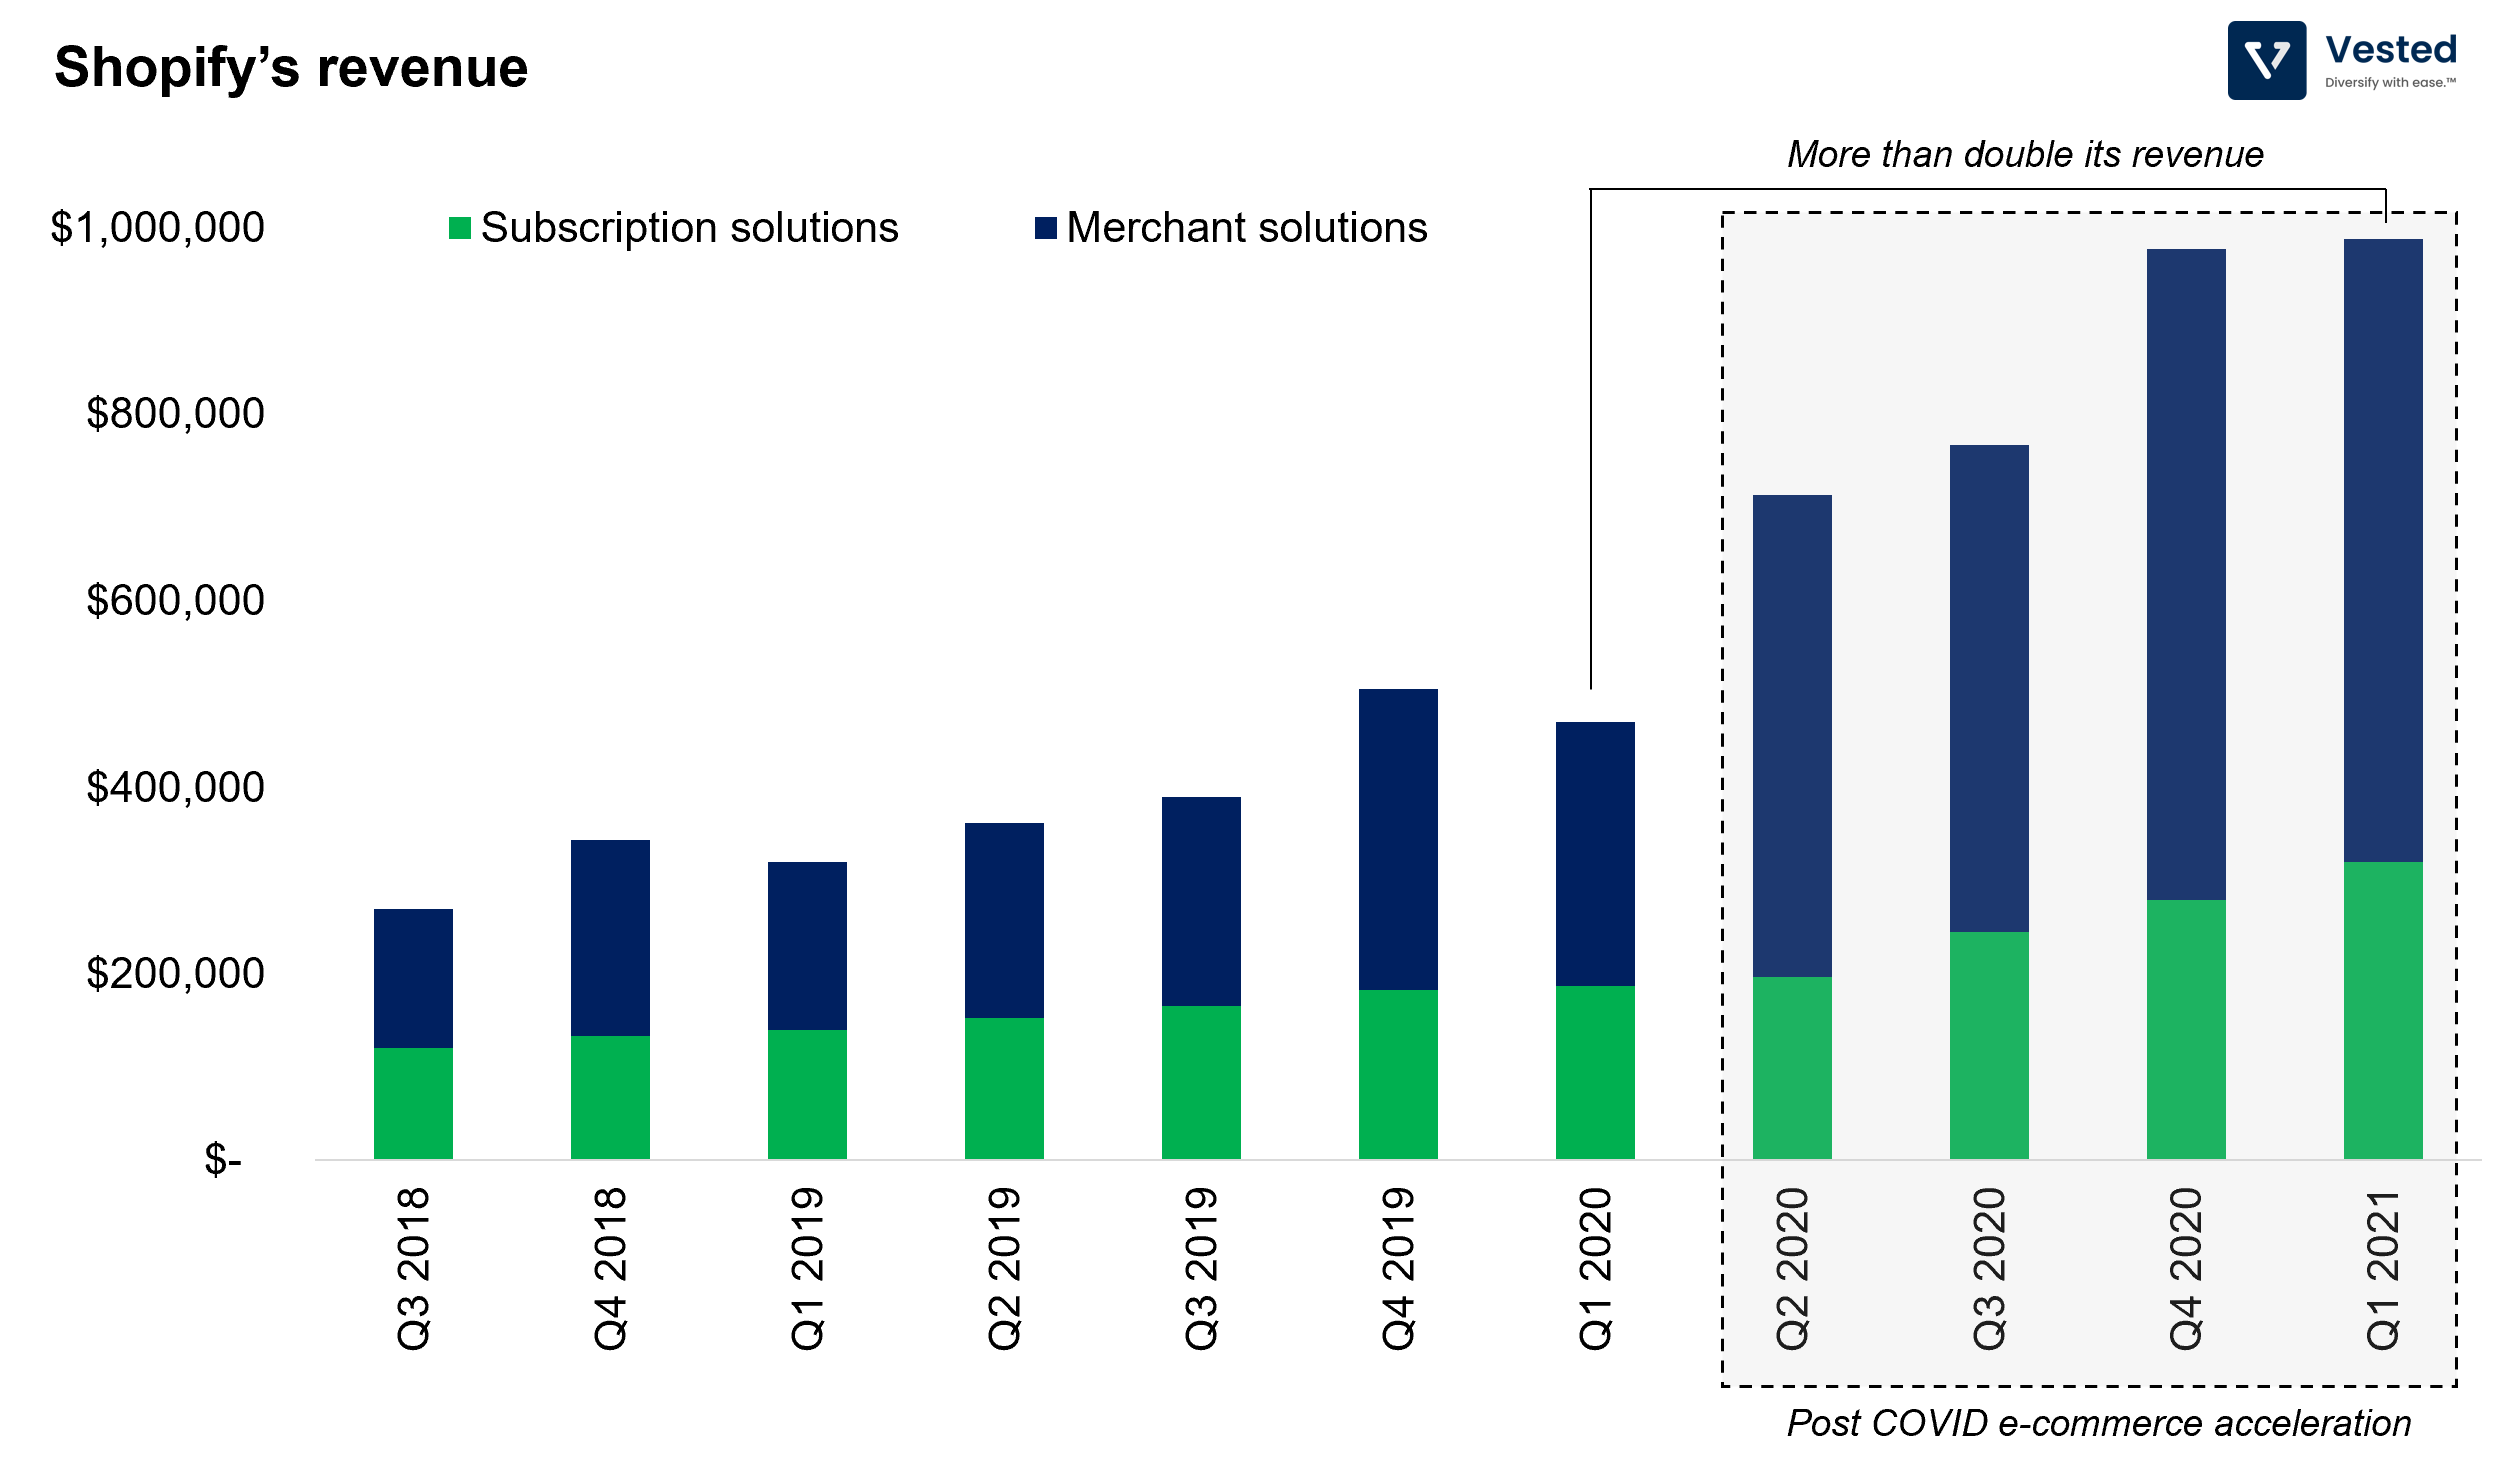
- See Figure 3 for Shopify’s quarterly revenue trends. Q1 2021 revenues were so strong that it matched Q4 2020 levels, which is typically the strongest quarter since it’s during the holiday season.
- Beyond the top line growth, the chart also shows how much Shopify’s business accelerated due to the ecommerce acceleration. Starting from Q2 2020, there was a sharp increase in revenue, followed by a much sharper growth rate.
Shopify’s fintech segment is growing the fastest. Revenue from Merchant solutions (blue bar), Shopify’s payment platform, is growing the fastest at 137% year-over-year vs. Subscription solutions (green bar), Shopify’s ecommerce software platform, which is growing 71%. This suggests that the primary revenue growth driver is not the increase in ecommerce shops, but the increase in gross merchandise value (GMV).
If you’re interested in reading more about Shopify’s business, we wrote a primer which you can read.
Amazon’s Q1 2021 Earnings
Of all the companies that we discuss today, Amazon has the largest footprint in the migration from physical to the digital. It generates revenue from ecommerce, payments, digital advertising and cloud infrastructure.
Here are four takeaways from Amazon’s earnings:
- Revenue grew 44% year-over-year to US$108 billion. Amazon also said that it expects sales between April to June to be between US$110 – 106 billion, if true, it would be the third quarter in a row where net sales exceeds US$100 billion.
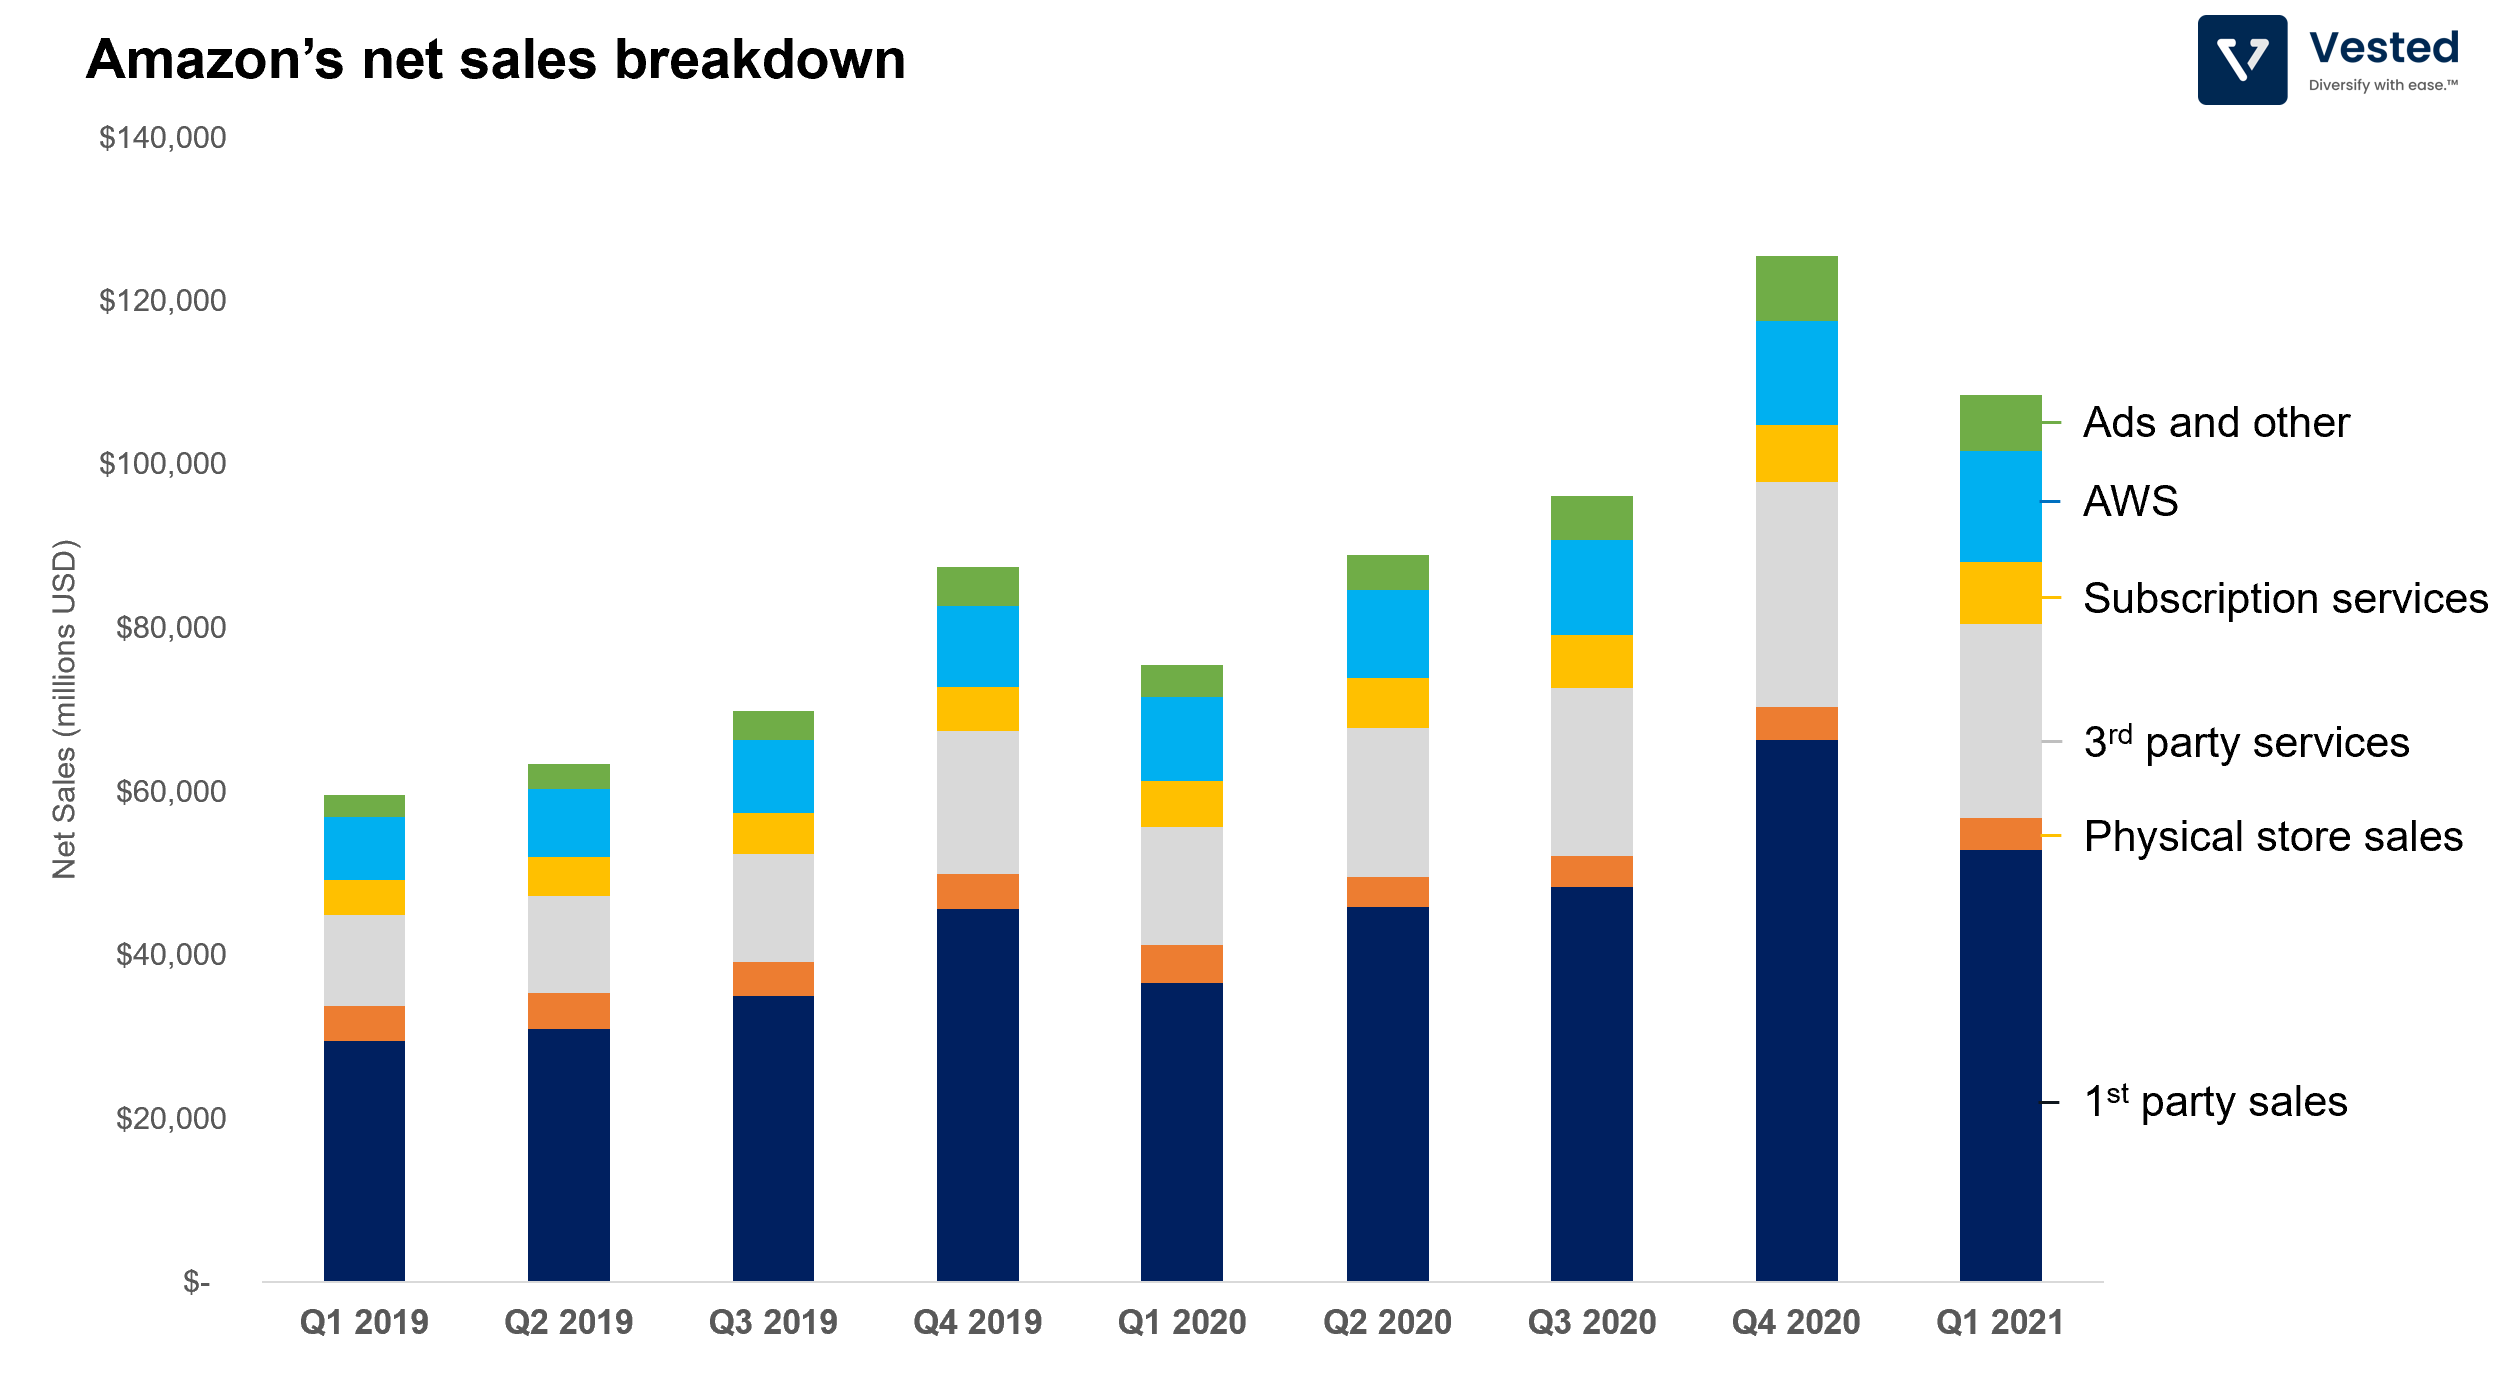
- Amazon’s net sales is so large with such diverse businesses that everything looks small in comparison. The green bar in Figure 4 represents net sales from Ads. Amazon made US$6.9 billion in advertising revenue, which is a 77% growth year-over-year. This is a fast growth rate considering their ads revenue is the third largest, behind only Google and Facebook.
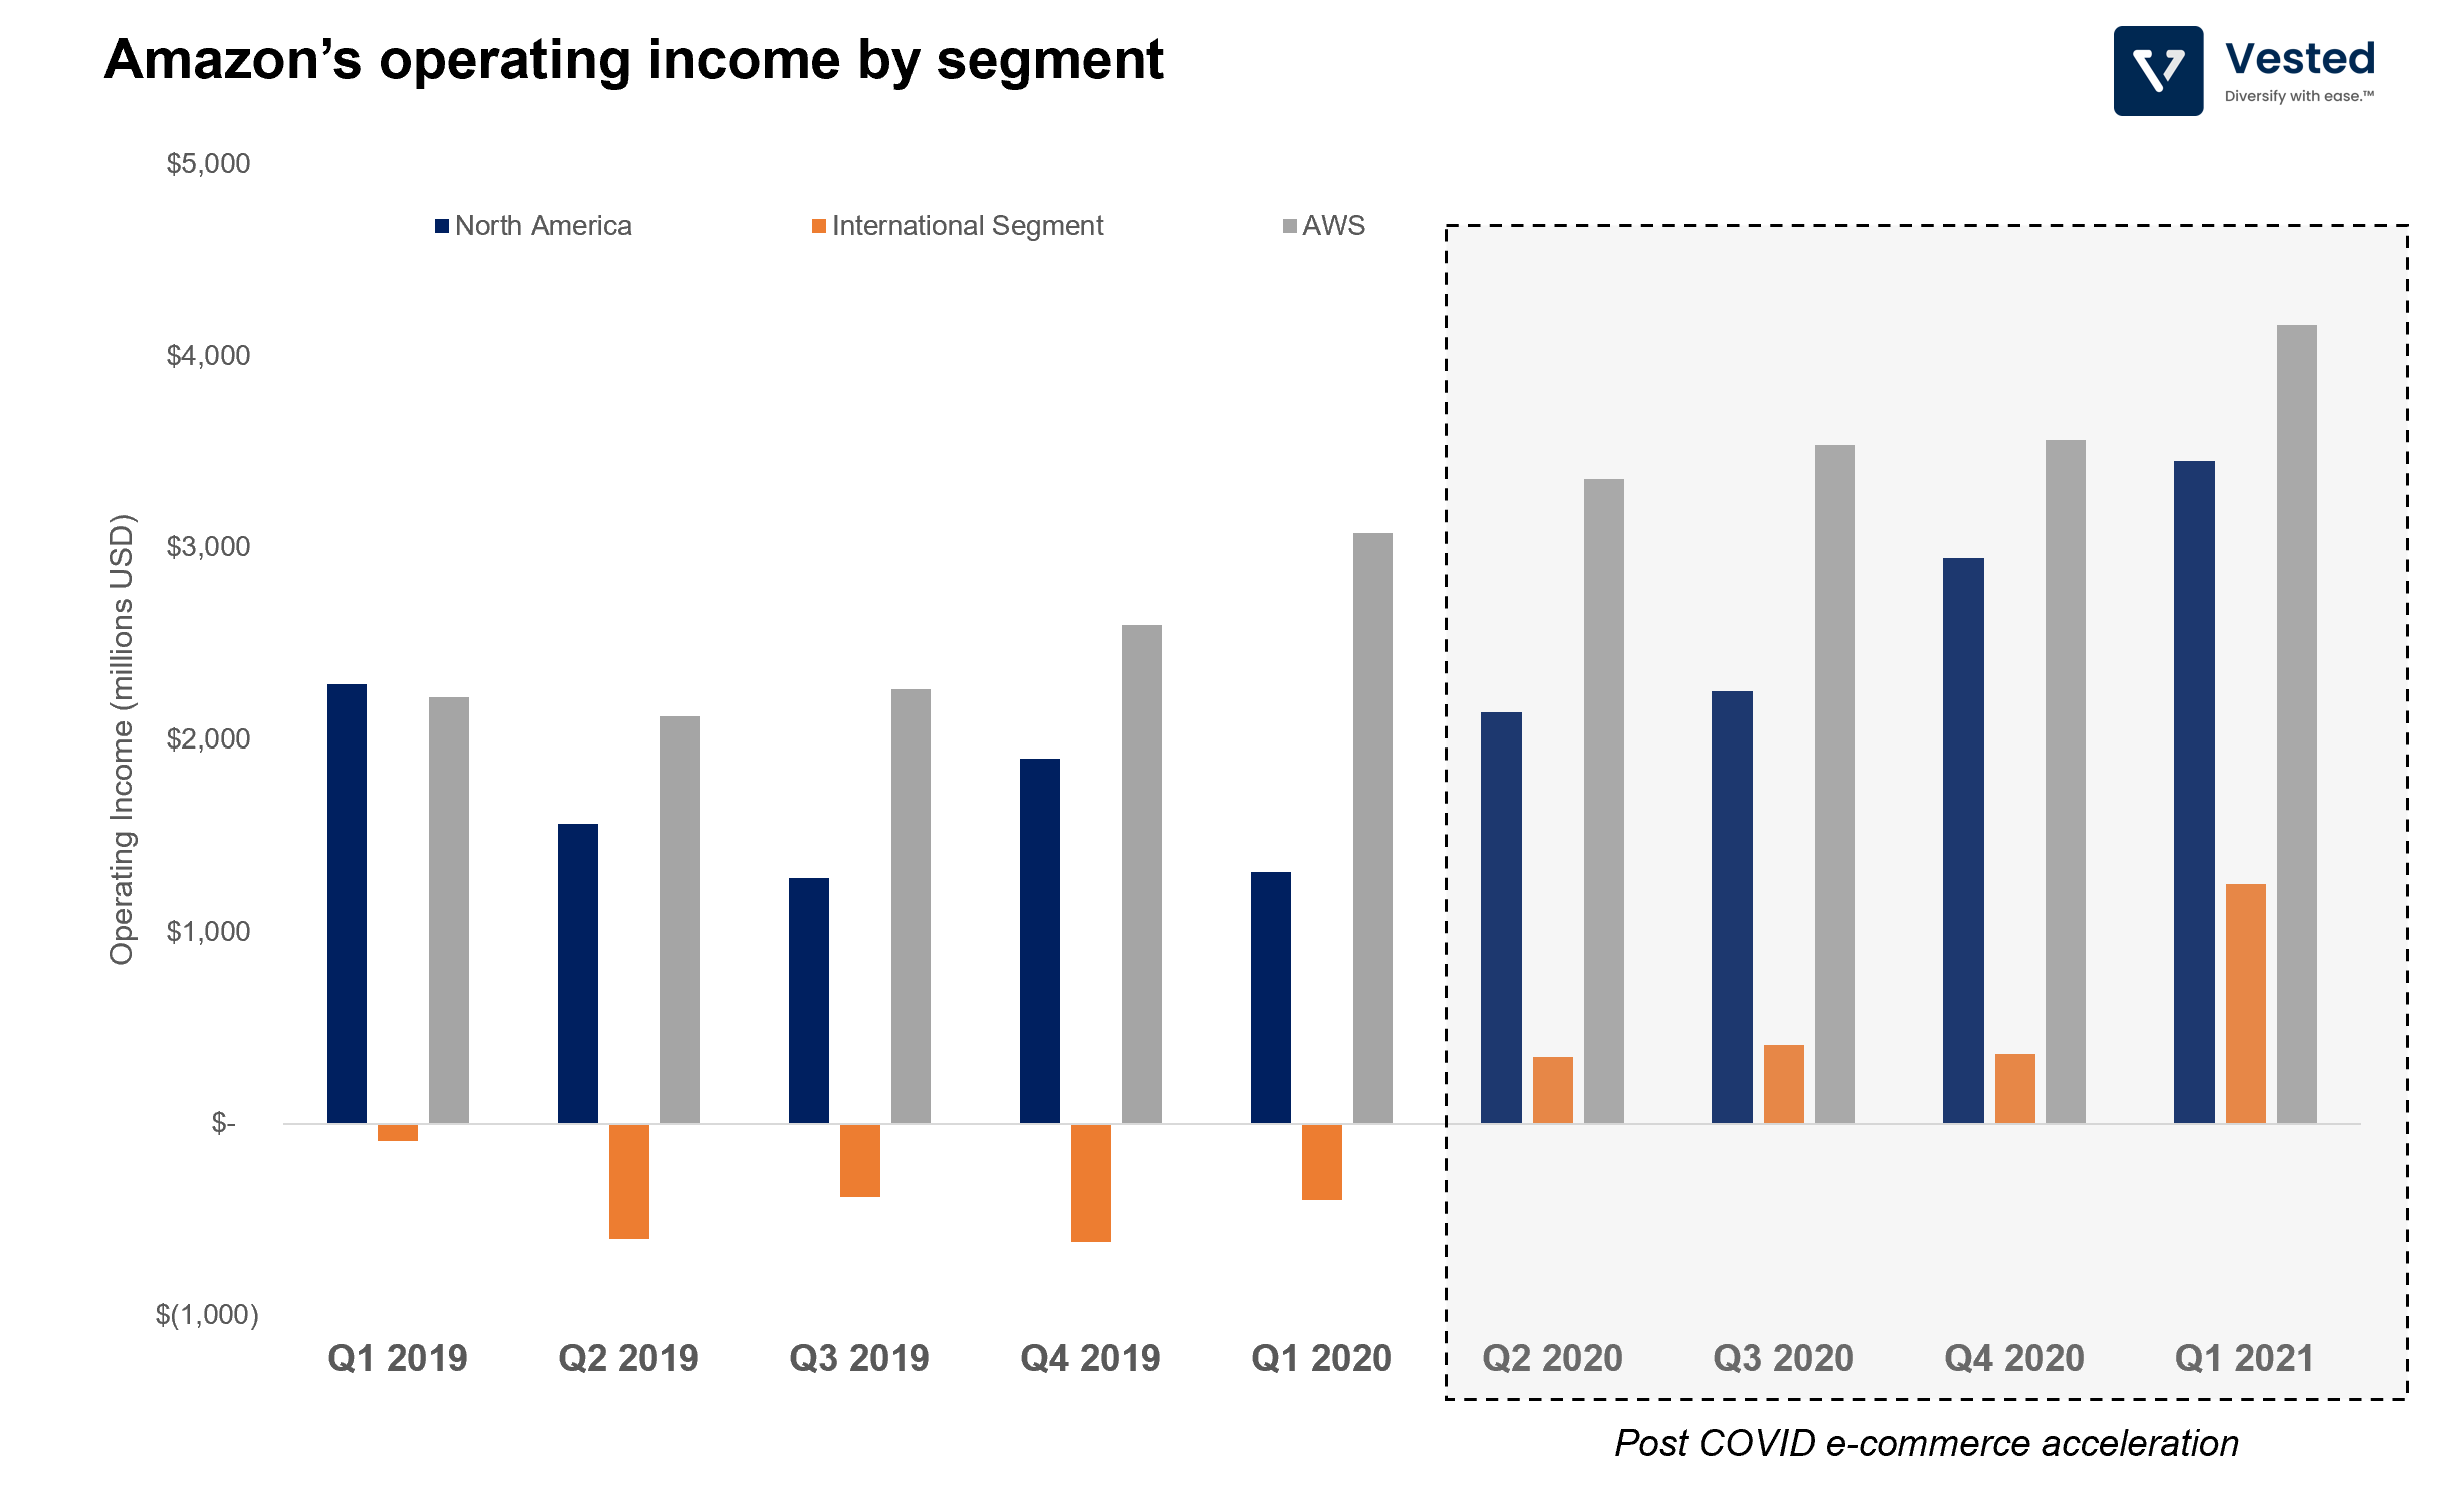
- The post-COVID ecommerce acceleration not only increased operating income for its North America segment, but also enabled its International segment to have positive operating margins (orange bar in Figure 5). This trend continued in Q1 2021, where it sequentially went up 2.5x.
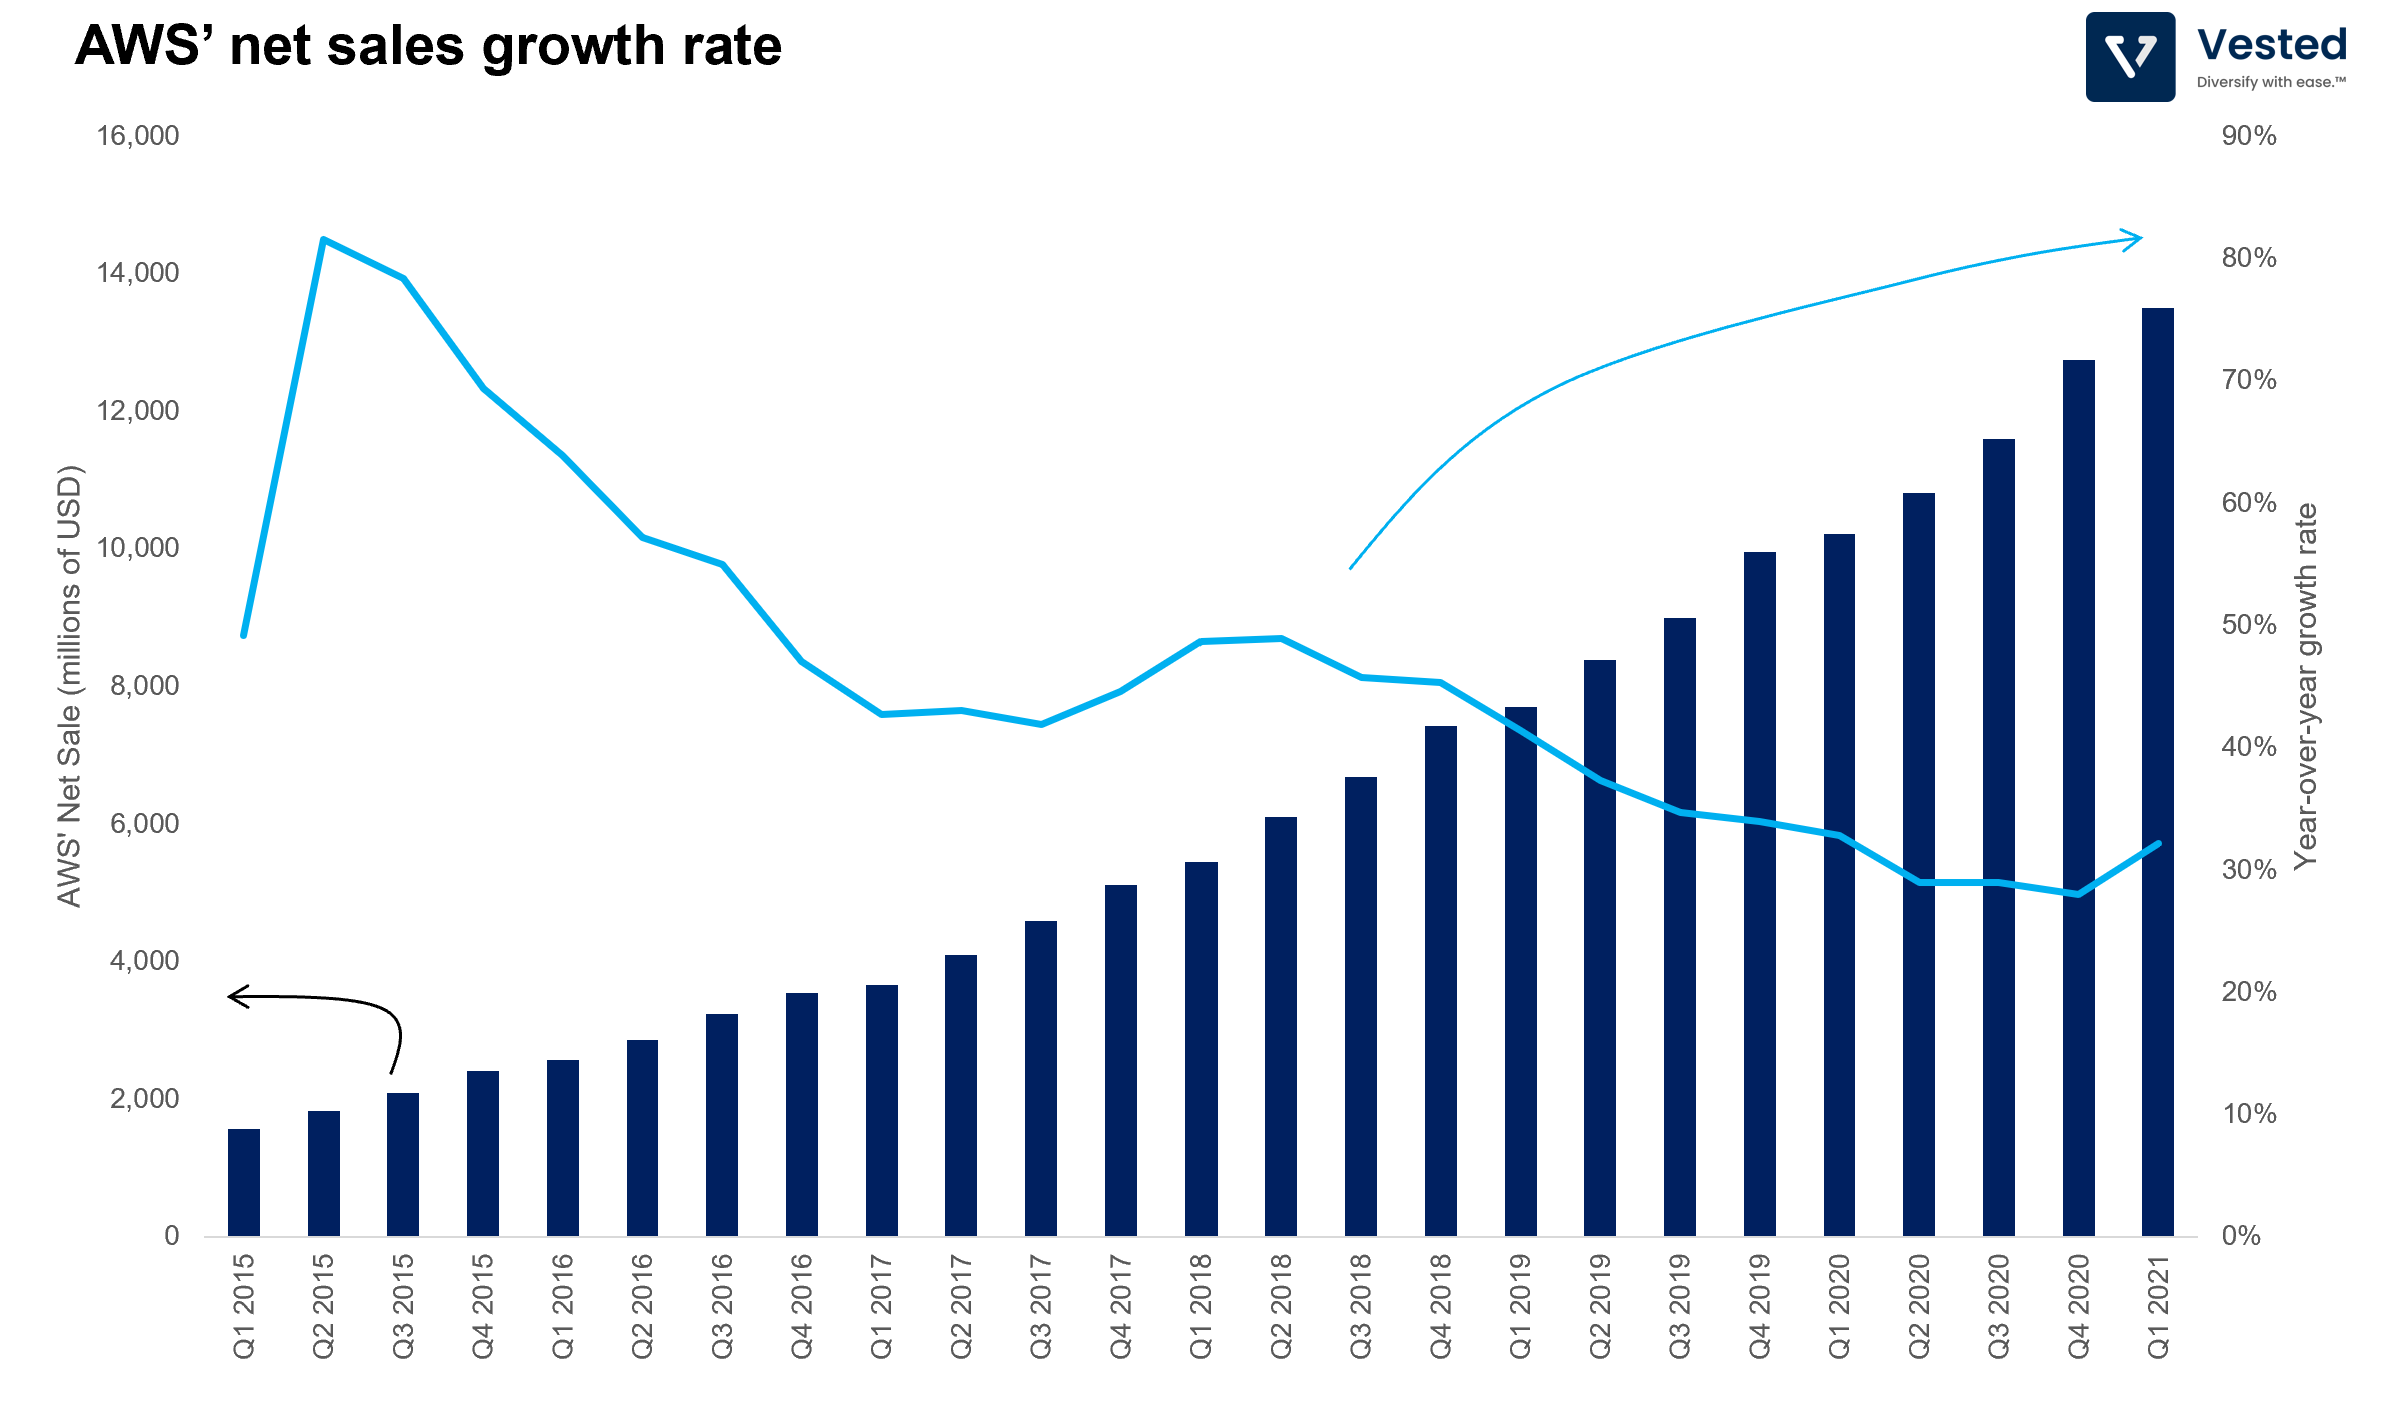
- And finally, AWS, arguably the most important segment of Amazon’s business (and the most profitable): In Q1 2021, AWS’ net sales growth rate increased sequentially (see blue line in Figure 6), growing 32% year-over-year.
If you’re interested in reading more about Amazon’s business, we wrote a primer which you can read.
Companies that enable businesses to advertise online: Google, Facebook, and Snap
All three ads companies reported record earnings, beating analysts’ expectations.
- Google reported revenue of US$55.3 billion (beating expectations by 7%), a 34% increase year-over-year.
- Facebook reported revenue of US$26.2 billion (beating expectations by 10%), a 48% increase year-over-year.
- Snap reported revenue of US$770 million (beating expectations by 4.1%), a 75% increase year-over-year.
Let’s take a closer look at Google’s and Facebook’s earnings.
Google’s Q1 2021 earnings
Two key takeaways:
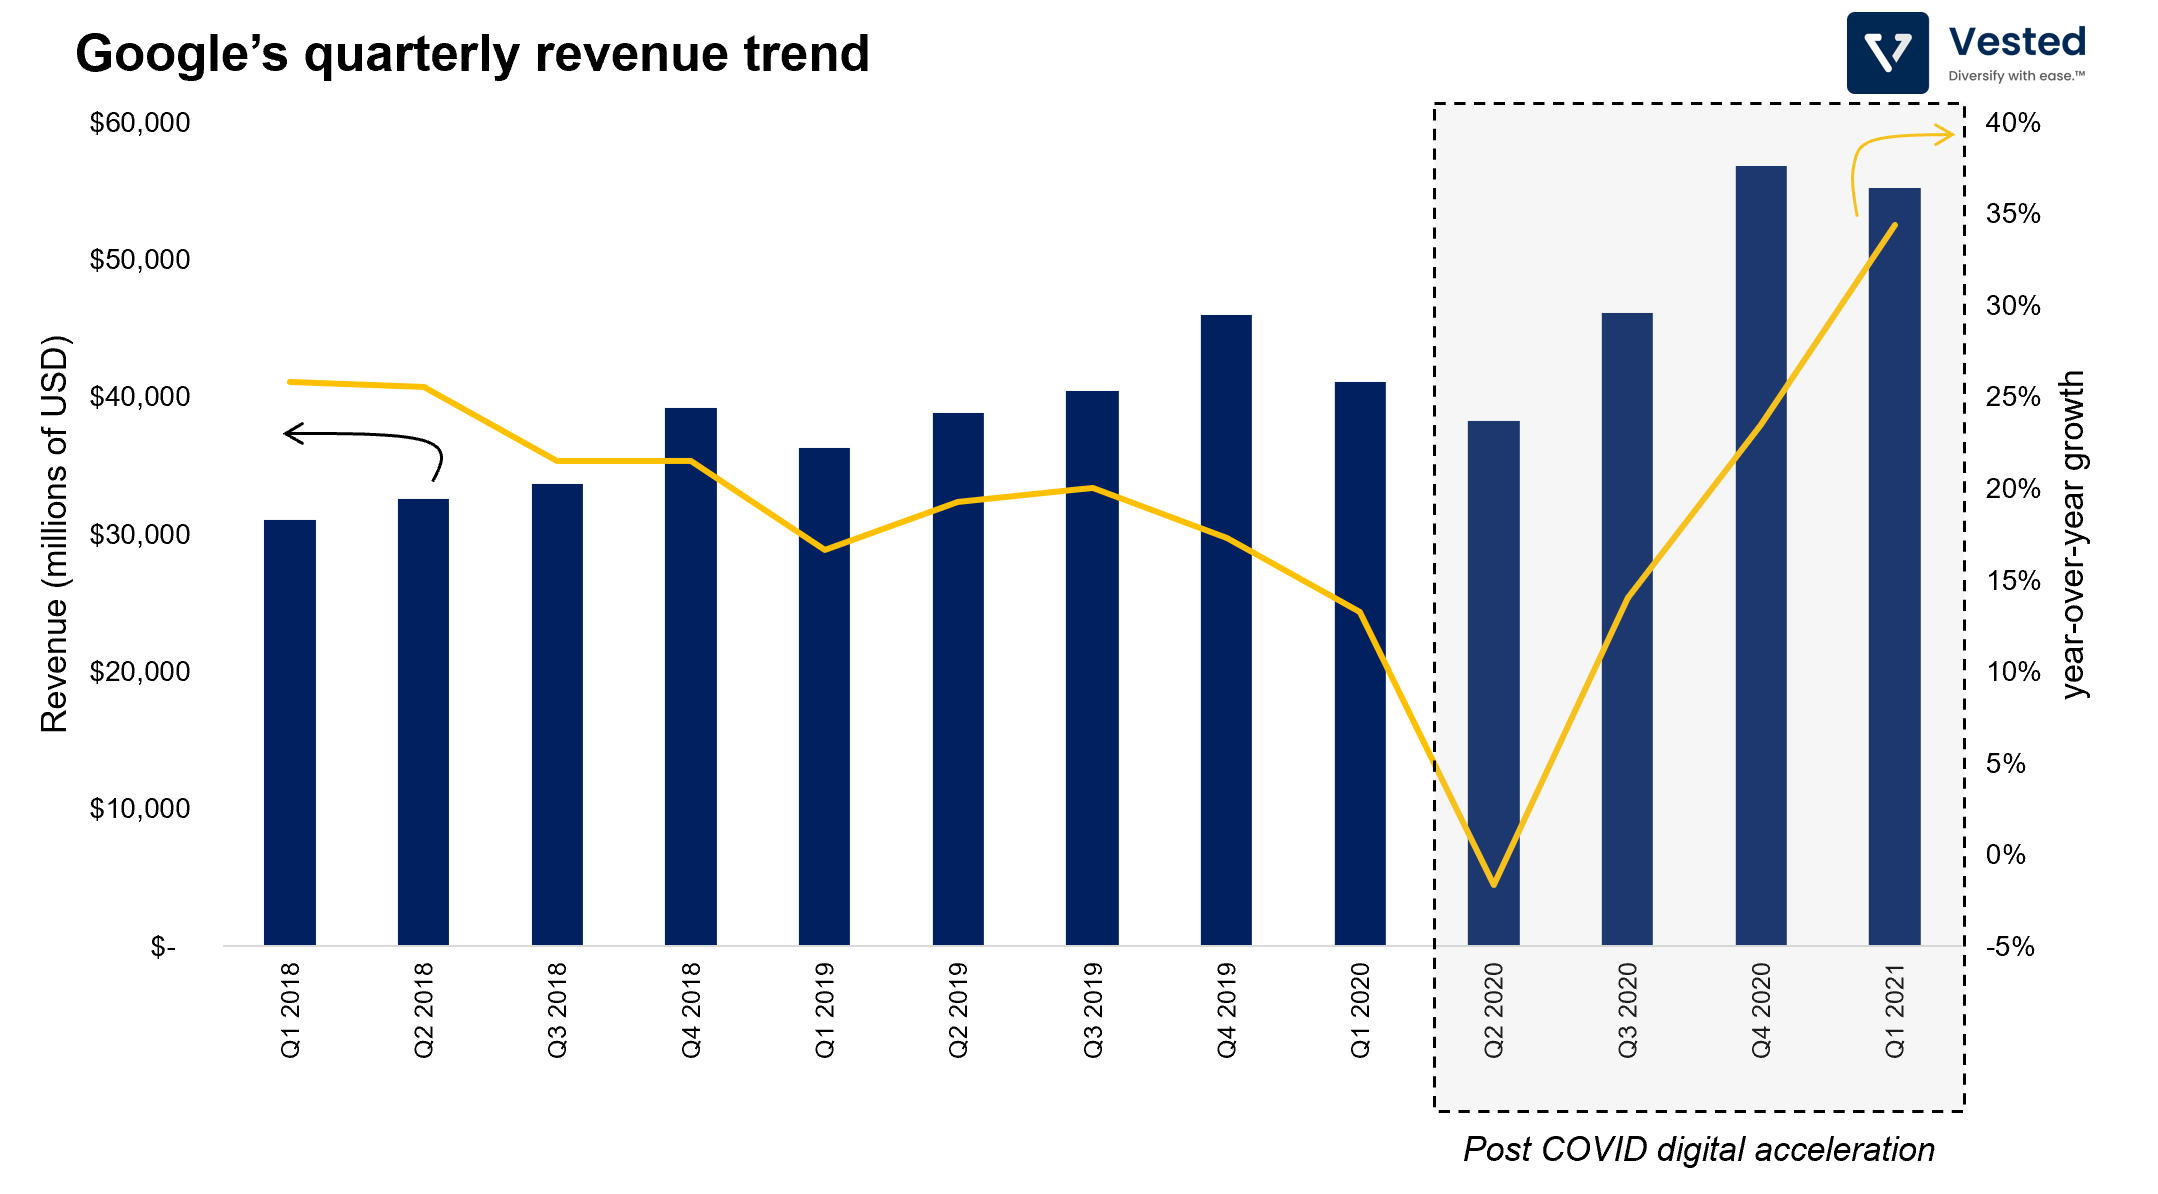
- This past quarter was Google’s strongest Q1 ever (blue bar in Figure 7). After a dip in growth in Q2 2020, when the first global lockdown occurred, revenue growth rate continued to accelerate unabated (yellow line).
- YouTube Ads was the fastest advertising revenue segment, growing 49% to US$6 billion (or 11% of total revenue). Adoption of YouTube has increased post the pandemic. According to a recent Pew report, YouTube saw usage grow from 73% of U.S. adults in 2019 to 81% in 2021.
Facebook’s Q1 2021 earnings
Here are three key takeaways from Facebook’s earnings announcement:
- The strong revenue performance in Q1 is driven by two factors: increased ad impressions served (a 12% increase driven by Facebook and Instagram) and higher price per ads (a 30% increase due to increased demand from advertisers).
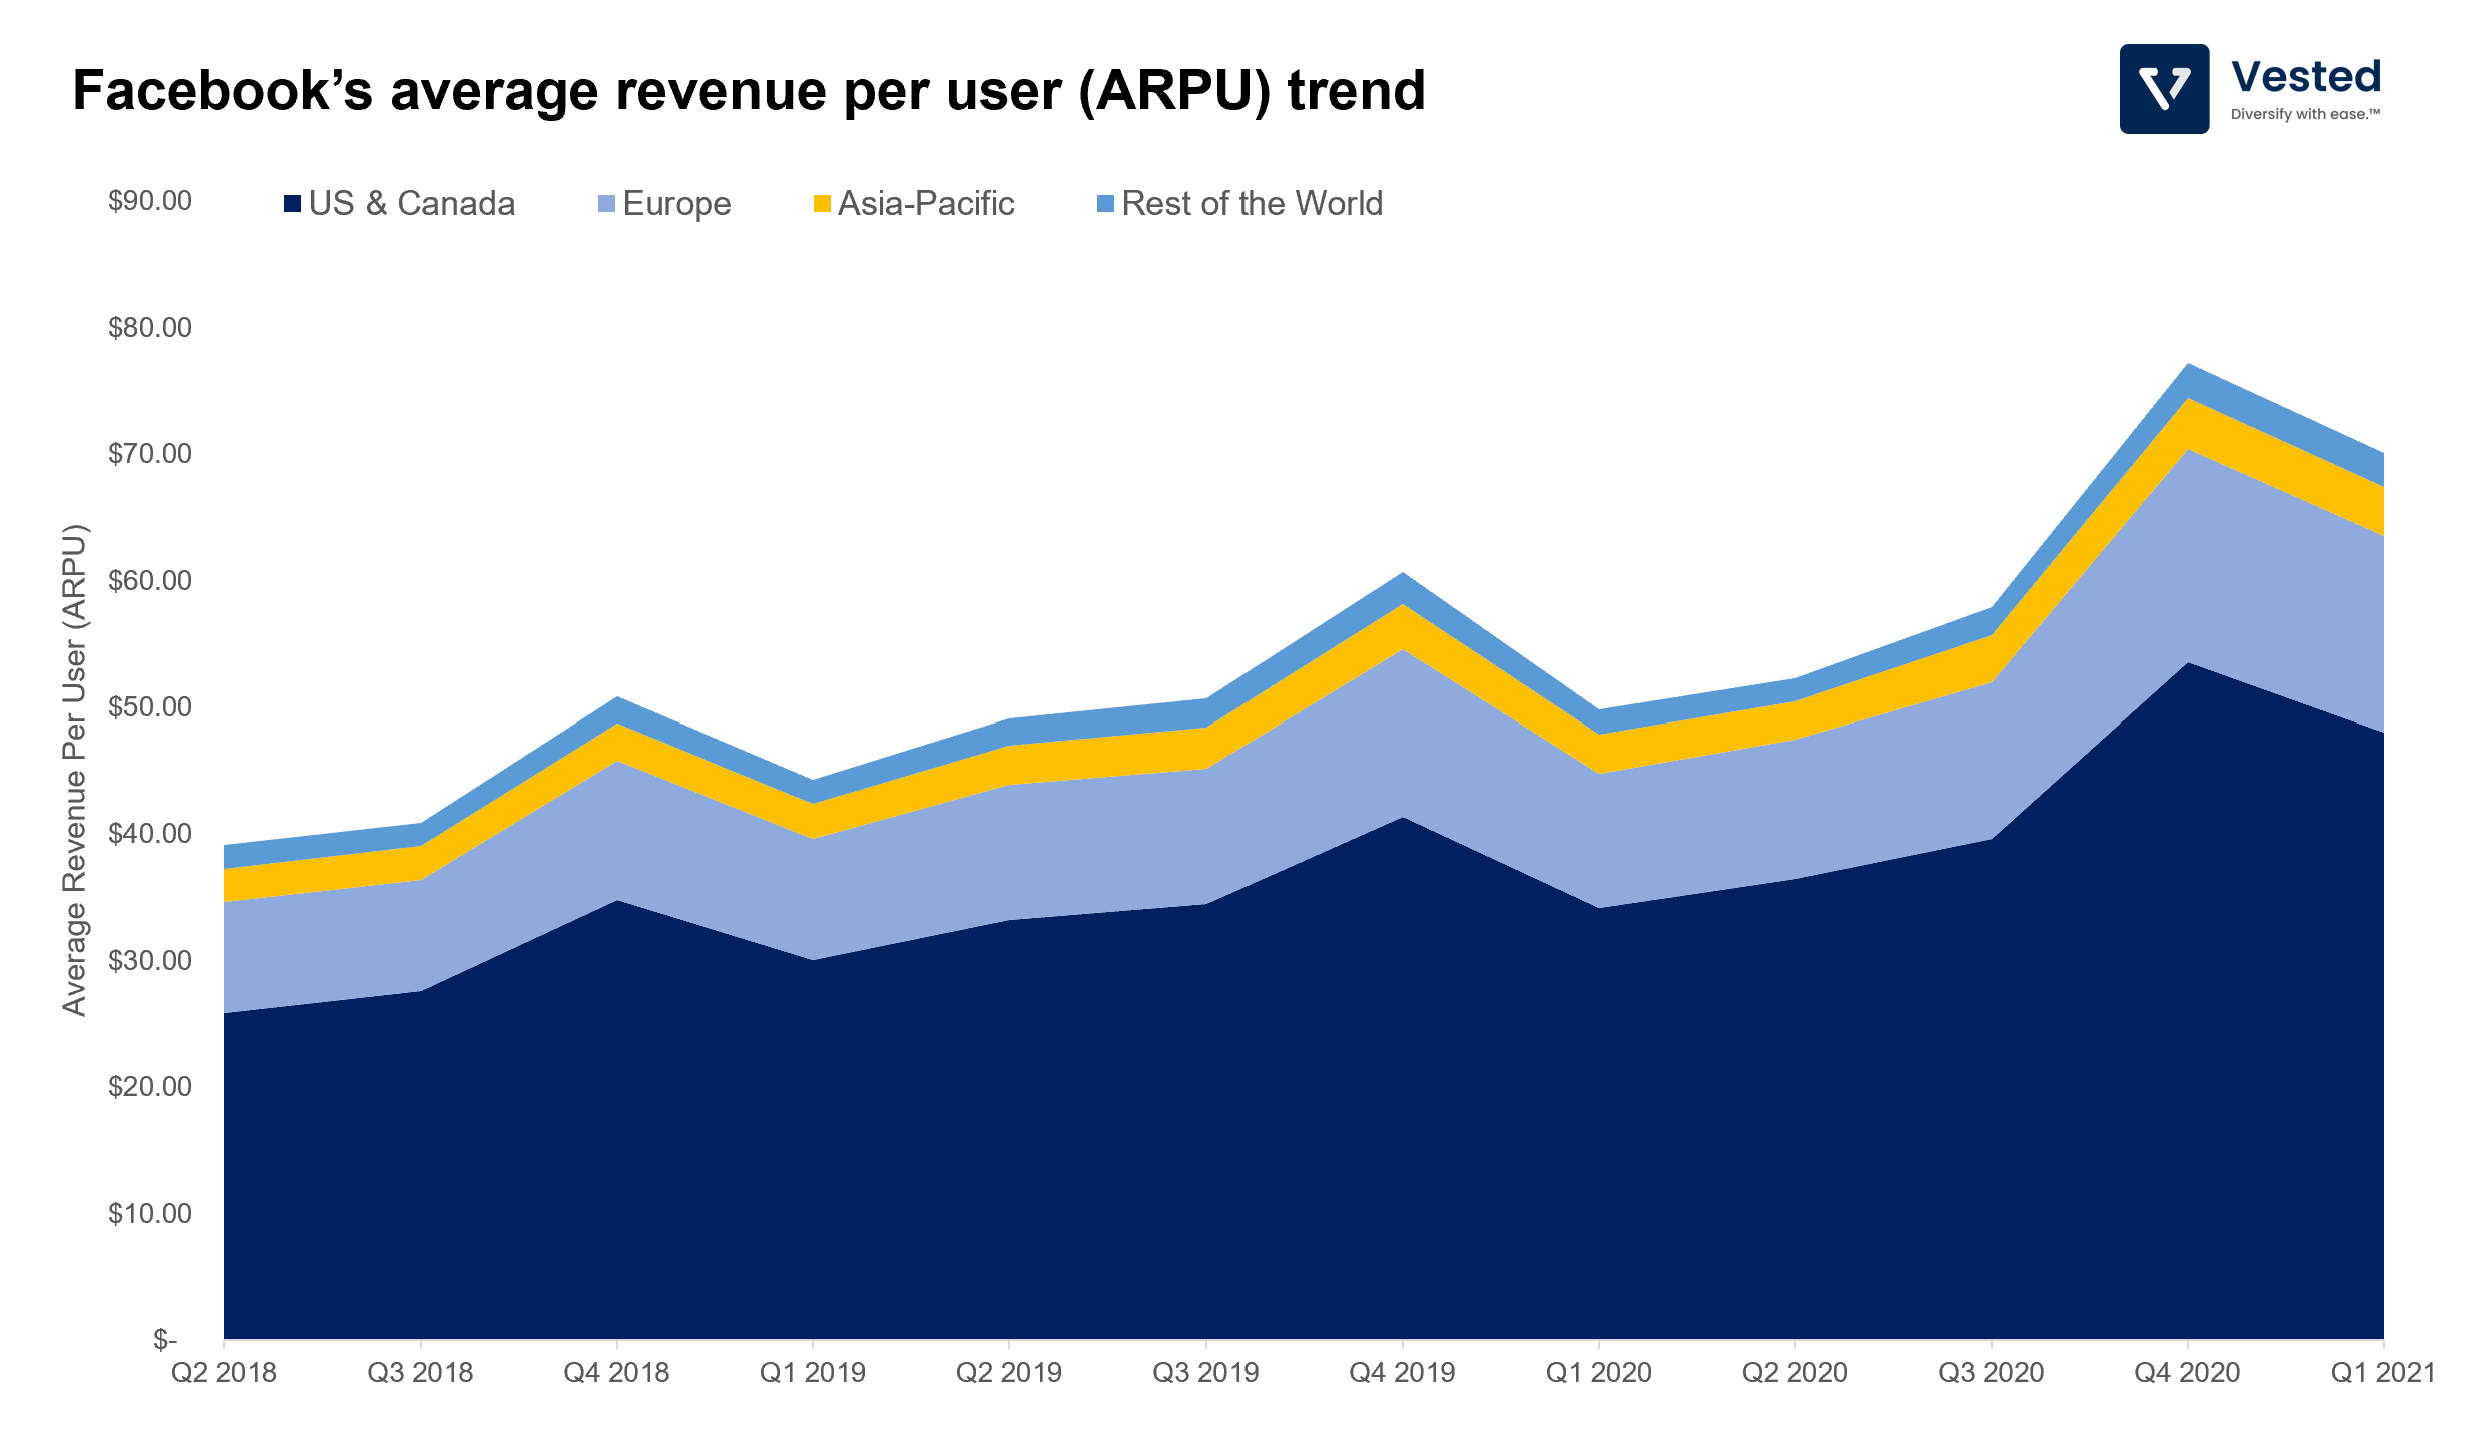
- Engagement across Facebook’s platform went up, and with increasing costs per ad, Facebook was able to derive more revenue per user (ARPU). Europe’s ARPU grew 53%, while the Rest of World, Asia-Pacific, and the US & Canada grew 47%, 46%, and 42% respectively. Note that US & Canada and Europe are the two most profitable regions for the company (Figure 8).
Ok – that’s it for today’s article. After reviewing these companies in quick succession, it does boggle the mind how these companies, even after achieving their massive scale, are still growing double-digit percentage points year-over-year.
