 Skip to content


With the recently proposed regulatory changes in India, investing in Bitcoin from India might become cost prohibitive. For those not in the know, the new proposal which would take effect the first half of 2022 includes a 1% tax (TDS) for every buy/sell transaction and a 30% tax on profits.
In order to provide an alternative way to invest in Bitcoin, we have created a model portfolio (a Vest) which tracks the price of BTC. This Vest is constructed using equities of various publicly traded companies and/or ETFs that have exposure to BTC. You can generally categorize companies with exposure to BTC across three categories:
- Companies that make money from the trading of crypto.
- Companies that hold BTC in their treasury holdings.
- Companies that mine BTC.
Companies that make money from the trading of crypto
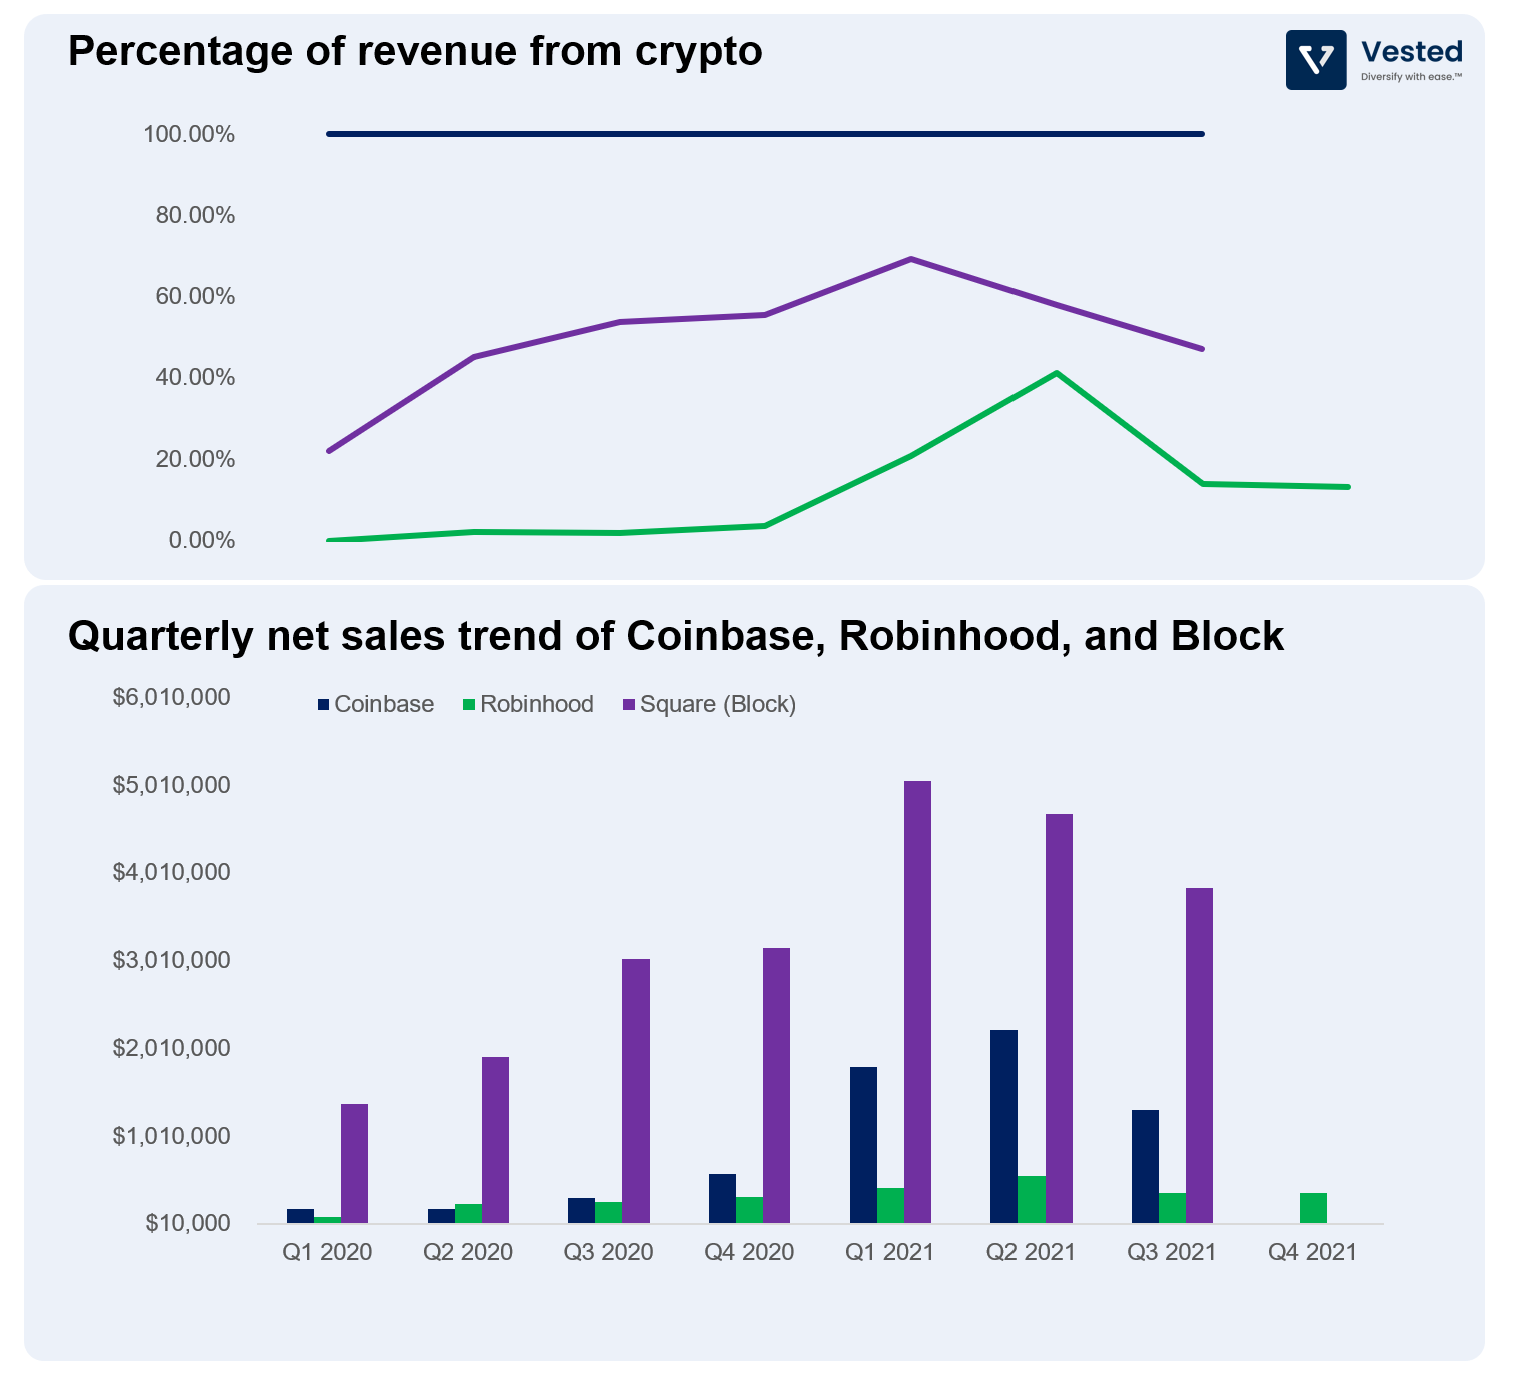
In this category, we have several fintech companies that enable retail investors (in the US) the ability to buy/sell crypto. These companies generate high margin revenues by charging transaction fees and spread on the price (see Figure 1). We’ve previously done deep dives into these companies:
- Coinbase (see deep dive coin base Strategy and Ecommerce & Crypto Coin base)
- Robinhood (see deep dive Robinhood IPO)
- Square (see deep dive Square buying)
A few comments:
- Coinbase (purple) derives 100% of its revenue from crypto related activities: transactional and subscription/services.
- Robinhood (green) offers crypto trading functionality, but compared to the other two companies here, it generates the smallest amount from crypto (its primary revenue source is equity options trading).
- Square (or Block) generates between 40% – 60% of its revenue from Bitcoin transactions (at about ~2% margin) through the Cash App, its direct-to-consumer financial app. Unlike Robinhood and Coinbase, it only provides Bitcoin trading functionality. Afterall, Jack Dorsey, its CEO, is a Bitcoin maximalist.
Companies that hold BTC through their treasury holdings, but generate revenue through other means
In this category, we include companies that hold a significant amount of crpyto, but generate their revenues through other means. The two companies in this category:
- Tesla (the EV maker), who owns about ~42,072 BTC.
MicroStrategy (Analytics software provider), who owns (as of February 2022) about ~53,922 BTC, at the average cost of $48,710 per BTC.
Companies that mine BTC
These are publicly traded companies whose main business is to mine BTC. They typically also hold a lot of Bitcoin. Before we list which Bitcoin mining companies that are included in this Vest, let’s walkthrough the business of mining Bitcoin. Here’s a primer on the business of Bitcoin mining:
A primer on the business of mining Bitcoin
The business of mining BTC is relatively simple. In a way, it’s similar to the business of making aluminum. Within the aluminum industry, the joke is that the metal is basically solid electricity.
Despite being one of the most abundant elements on the planet, for the majority of human existence, the existence of pure metal aluminum is extremely hard to come by. So much so that in the early 1800s, emperor Napoleon Bonaparte reserved his aluminum dinnerware to be used only when he was hosting foreign royalties. For others, silver or gold sufficed. At the time, aluminum was more valuable than gold.
But that changed in the 19th century, when the industrial process to produce aluminum metal using electricity was discovered. Nowadays, the process is so cheap and efficient that the cost of producing the metal is largely dependent on the variable cost of electricity. This is where the term solid electricity comes from.
In a similar way, the cost to mine BTC is almost directly related to the cost of electricity. These BTC mining companies find the cheapest, most abundant source of electricity, and use that to feed specialized BTC mining rigs to mine BTC. Their profit equation is as follows:
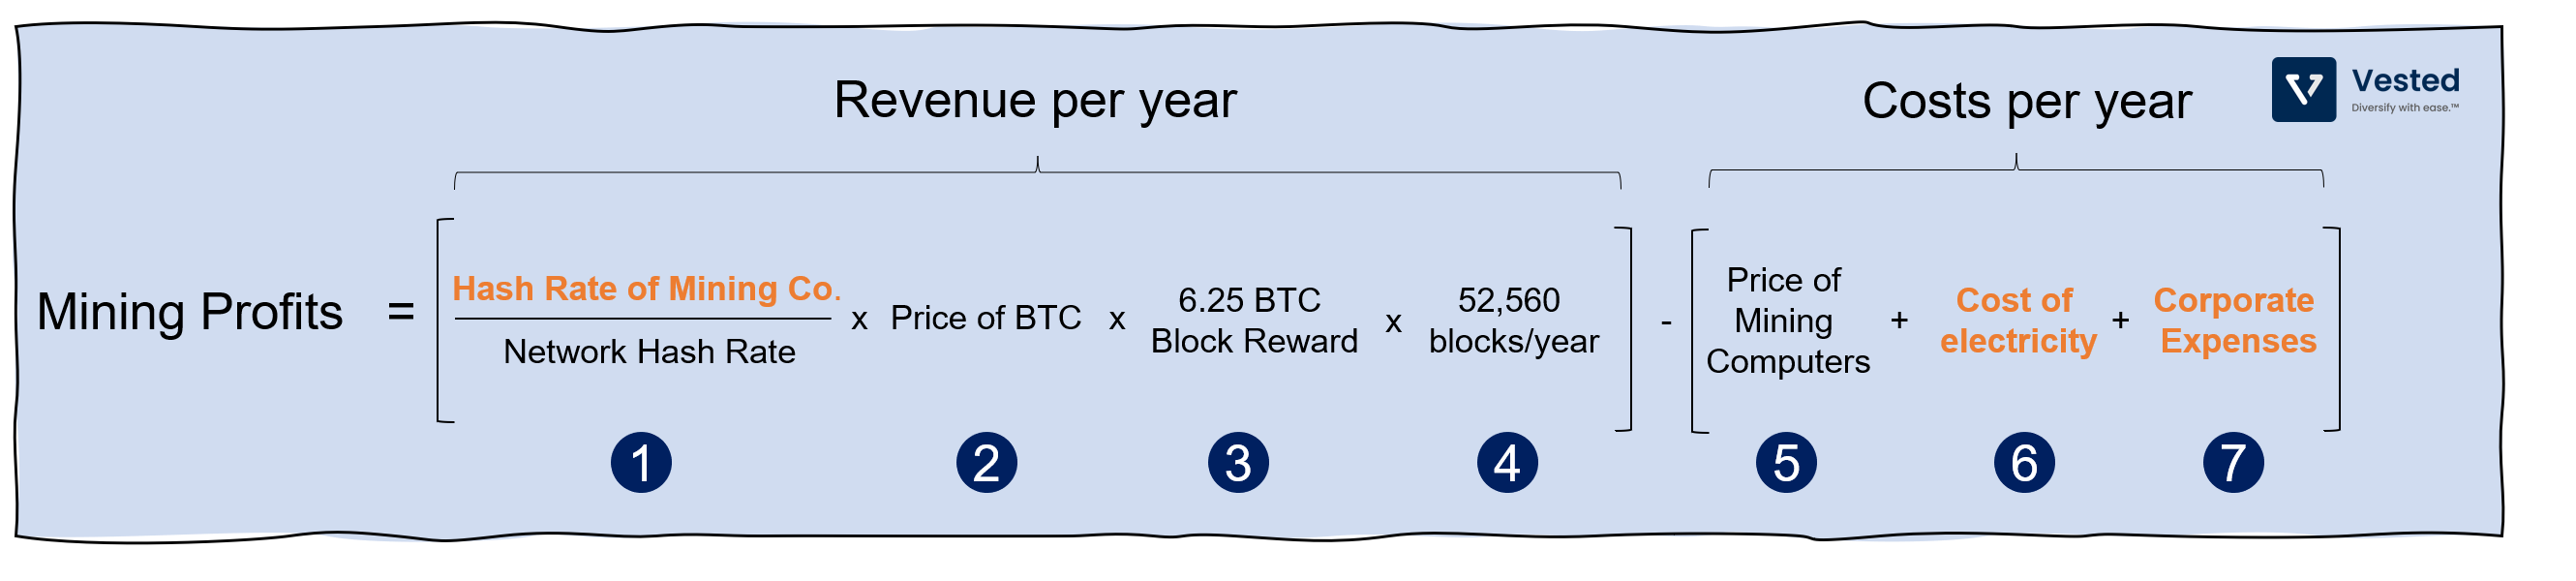
As you can see above, to generate mining profits, you have to…
Generate revenue, which depends on:
- (1) The ability to deploy large compute resources. A mining company would want to own a large hash rate (compute resource to solve a math puzzle) relative to the total compute resource in the BTC network. This ratio is (1) in Figure 2 above. For example, a mining company that has 5% of compute resources relative to the total mining power of BTC at any given time, has a 5% chance to mine the BTC block, and get the 6.25 BTC reward.
- (2) The price of BTC, which fluctuates over time.
- (3) The block reward. Anytime a miner forms a block successfully, the miner earns 6.25 BTC (which is the current block reward).
- (4) The rate of blocks formed. A block is formed roughly once every 10 minutes, which translates to a total of 52,560 BTC blocks per year.
Minimize costs, where mining companies have to consider:
- (5) Buying the latest BTC mining rig, as newer models offer higher compute resources (hash/s), while being more energy efficient. These machines typically have a lifetime of three years or so, if maintained well.
- (6) Finding the cheapest source of electricity. Most of these mining companies build their data centers attached to a power generating plant, behind the meter. Some companies focus on finding renewable energy sources. For example, Bitfarms mostly use hydropower plants in the US, Canada, Uruguay, and, soon, Argentina. The company is expanding to South America in pursuit of cheap energy.
- (7) The company’s corporate expenses.
Orange bolded texts in Figure 2 are variables that the mining companies have direct control over: Its own hash rate, the cost of electricity, and corporate expenses. In other words, to optimize profitability and most efficiently convert electricity to BTC, a company must have scale and rapidly grow that scale, specifically:
- Generate revenue and rapidly increase compute resources to increase probability of minting a block. In other words, increase (1). For example, Core Scientific, the largest publicly traded BTC miner, has an average electricity cost of $0.036/kWh, that is 2x cheaper than the average industrial electricity price in the US.
- With large scale, these companies can negotiate with power companies and sign long term agreements at lower costs. In other words, achieve lower (6). For example, Marathon, one of the largest players in this space, received an ~8.63% discount on its orders.
- And maintain efficient operations – lower (7).
Ok – so scale and ability to get cheap electricity drive the lowest cost. Here is the list of the direct cost per BTC mined for several BTC mining companies (Figure 3).
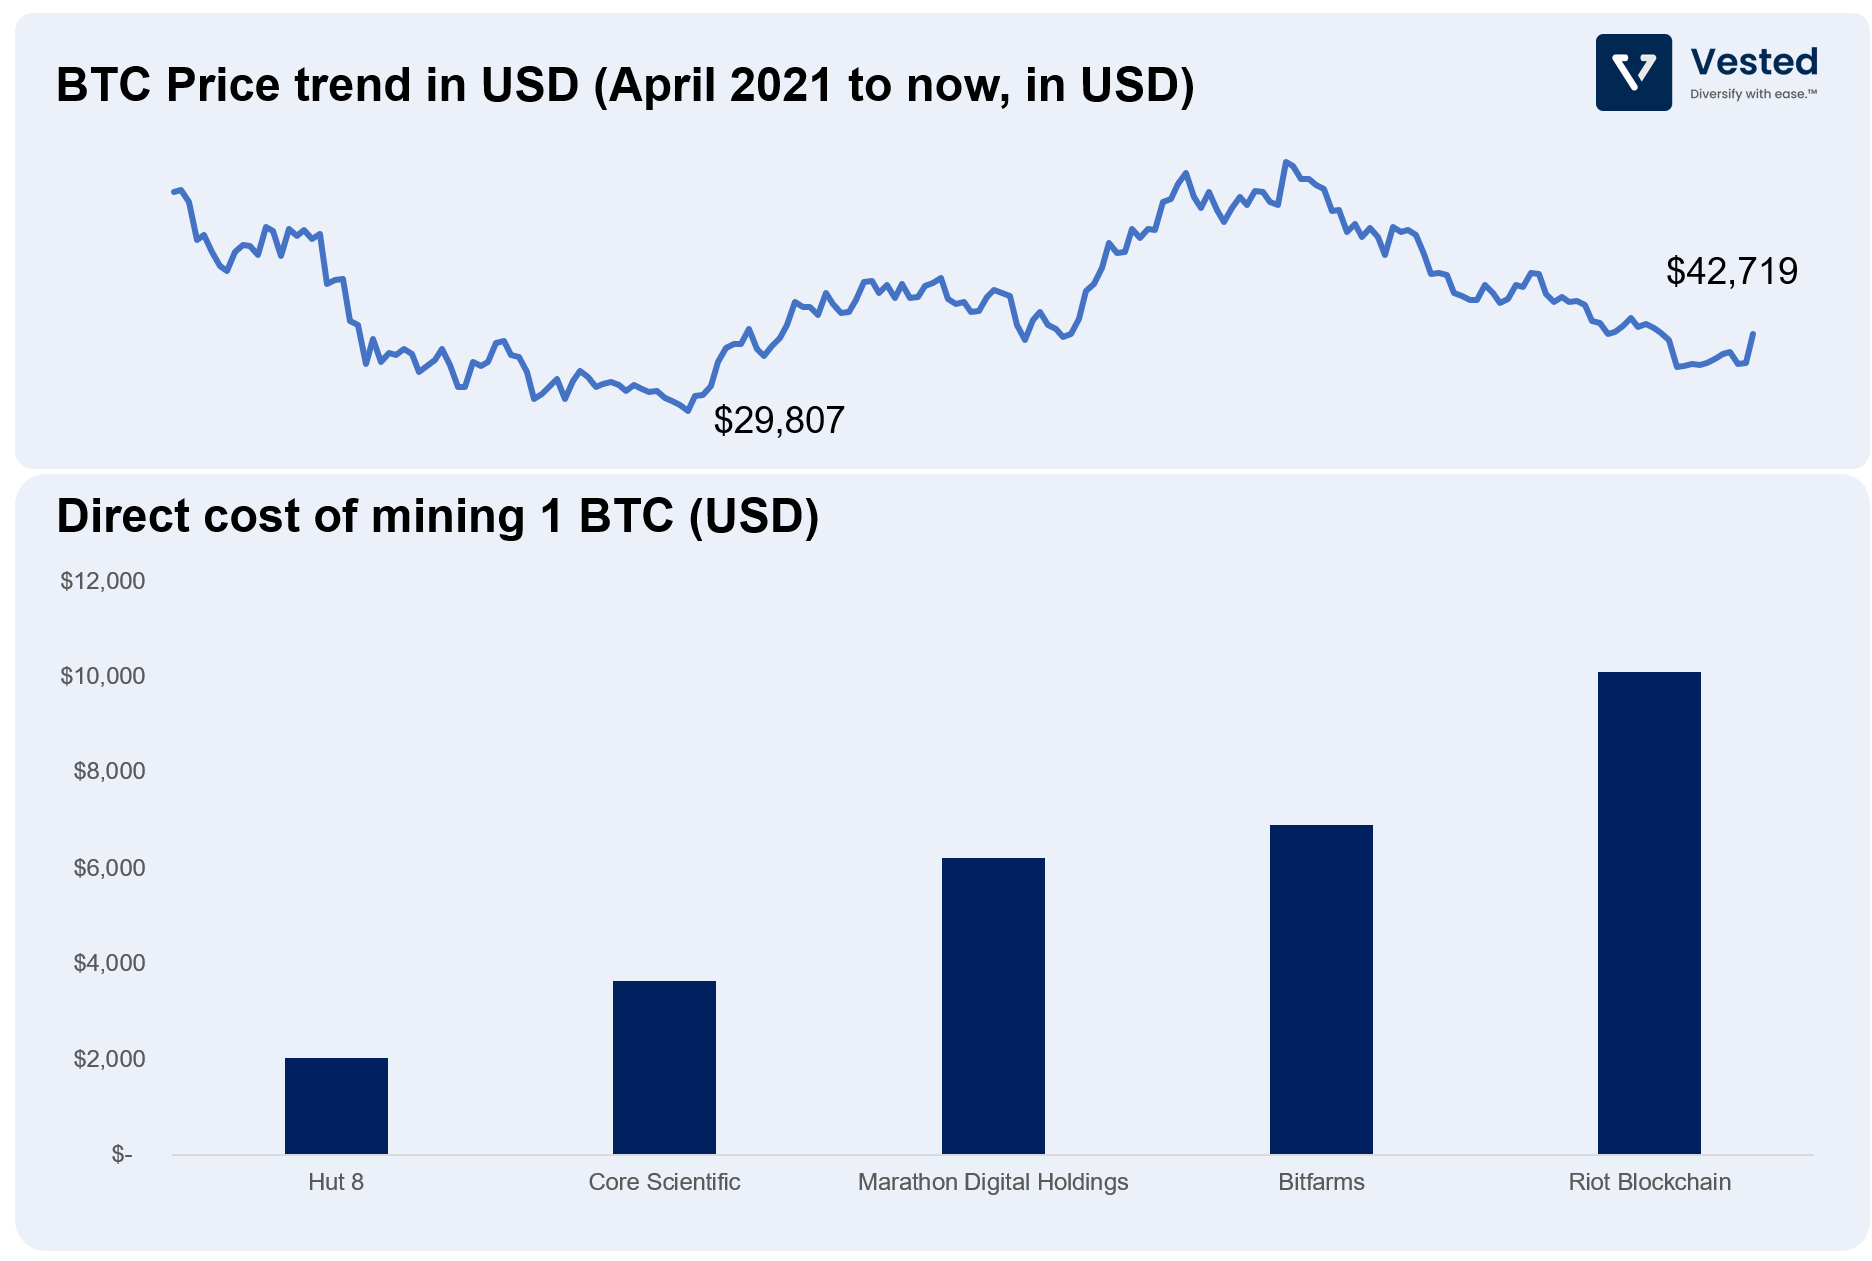
As you can see above, the direct costs vary greatly, ranging from $2,000 to $10,000 per BTC. These are the break even prices for these companies. If BTC drops below these prices, the rational choice is to stop operations. The line chart in Figure 3 above shows the historical price of BTC from the past 10 months. Despite the recent 37% drop from the most recent peak, there’s more room for BTC to drop before some of these mining companies must cease operations. One thing is clear though – all companies are profitable from a unit margin standpoint at the current prices.
In a way, this is a similar dynamic to oil production, where the cost to extract oil per barrel varies by county. According to 2016 data, the UK has one of the highest costs at $44 per barrel, while Saudi Arabia has the lowest (at ~$9 per barrel). When prices decline, the high cost producers shut down first.
However, unlike oil production, BTC mining can be turned on and off on-demand. In fact, many shut down voluntarily to avoid overloading the grid. For example, in response to winter weather in Texas, Riot shut down 99% of its operations in the state.
The Bitcoin Vest
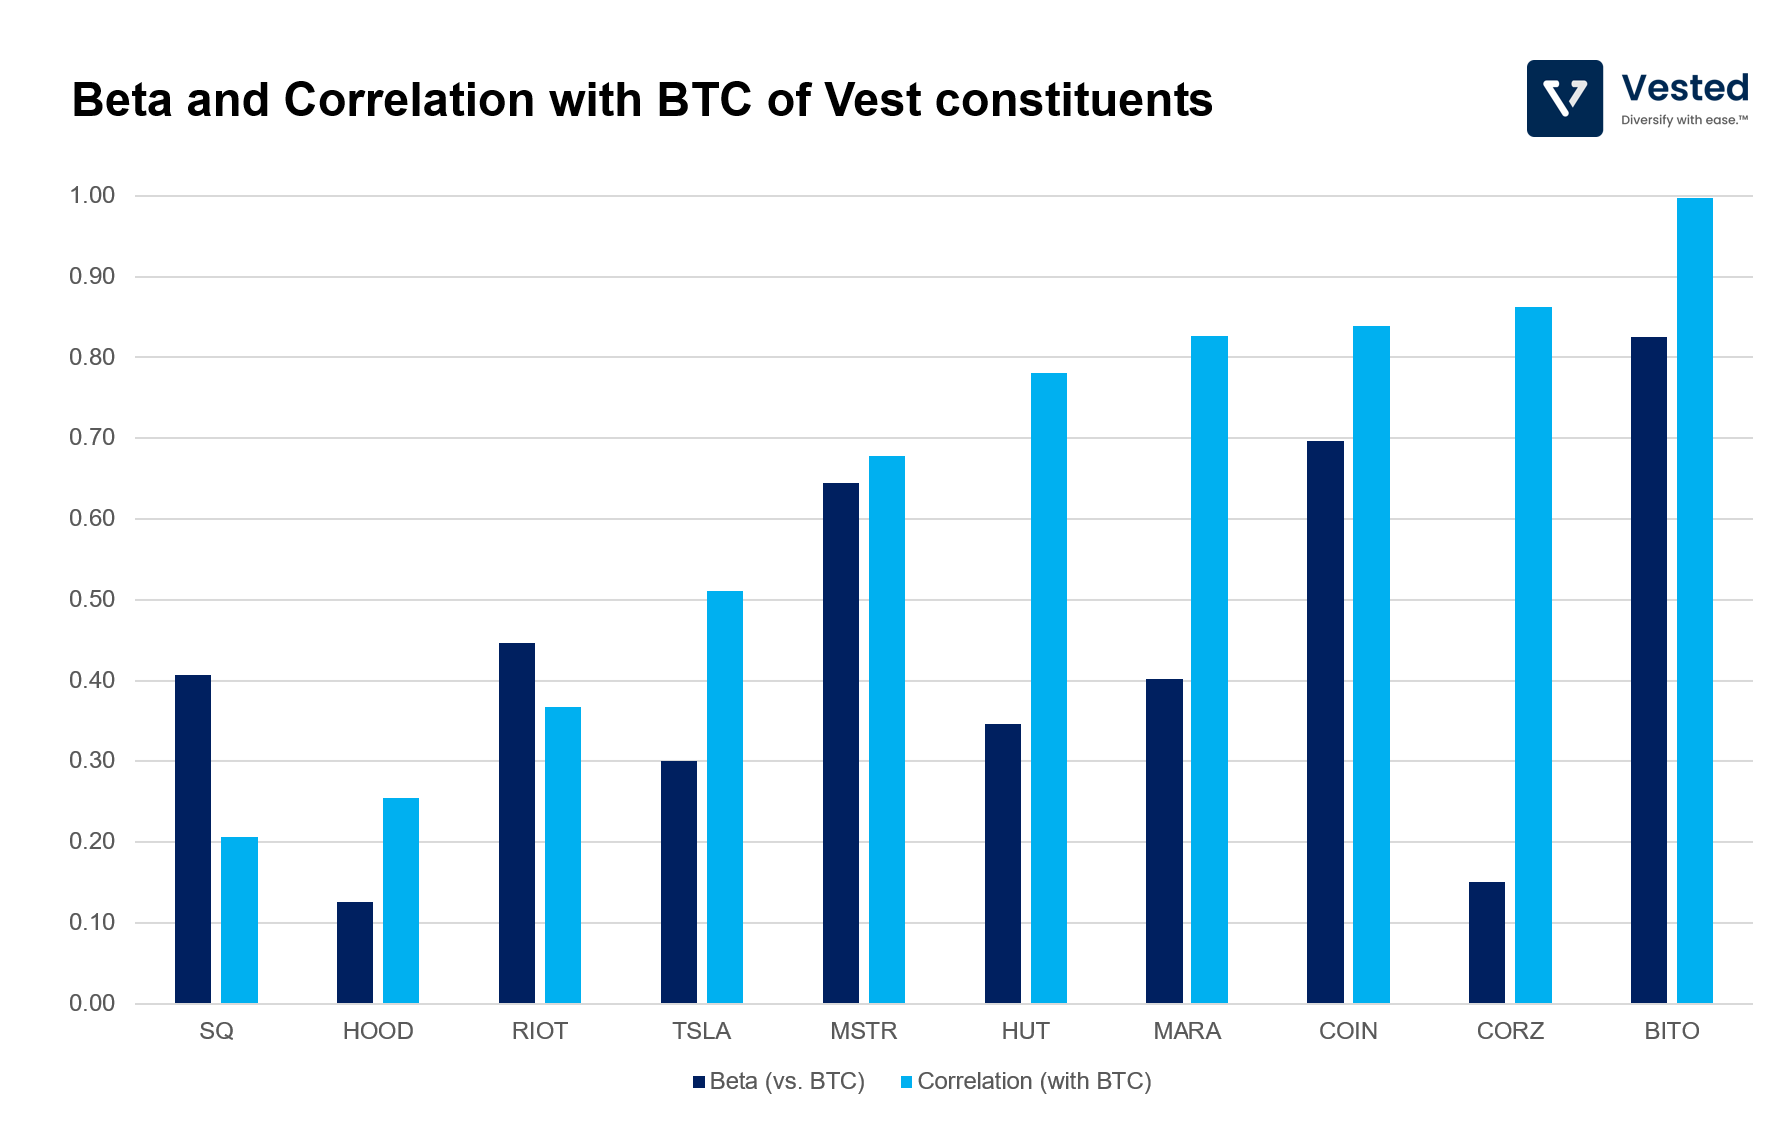
In order to create the Vest, we combined the leading BTC mining companies with the lowest direct costs (category 3) with companies in categories 1 and 2, and added a small allocation of ProShares Trust – ProShares Bitcoin Strategy ETF (BITO), a BTC futures ETF .
Despite their BTC exposures, companies in categories 1 and 2 have the benefit of generating other revenues outside BTC. For example, Robinhood generates revenue from equity trading, and Square/Block generates revenue from being a payments provider. This is why their correlation with BTC is the lowest. As such, the price movements of these companies act as a damper to the volatility of the mining companies, which tend to be much more volatile than BTC (after all, they hold a lot of BTC in their balance sheet and their profitability is directly correlated to the daily fluctuations of BTC).
The historical performance of the Bitcoin Vest (from April 2021 to current) is shown in Figure 5 below. The limited historical data is due to the fact that Coinbase went public only in April 2021. To generate the historical performance, we added more relevant companies that we discussed above as they became available (Robinhood was added to the Vest in August 2021, BITO was added in October 2021, and CORZ was added in January 2022). Each time new tickers were added, the hypothetical portfolio was rebalanced to equal allocation.
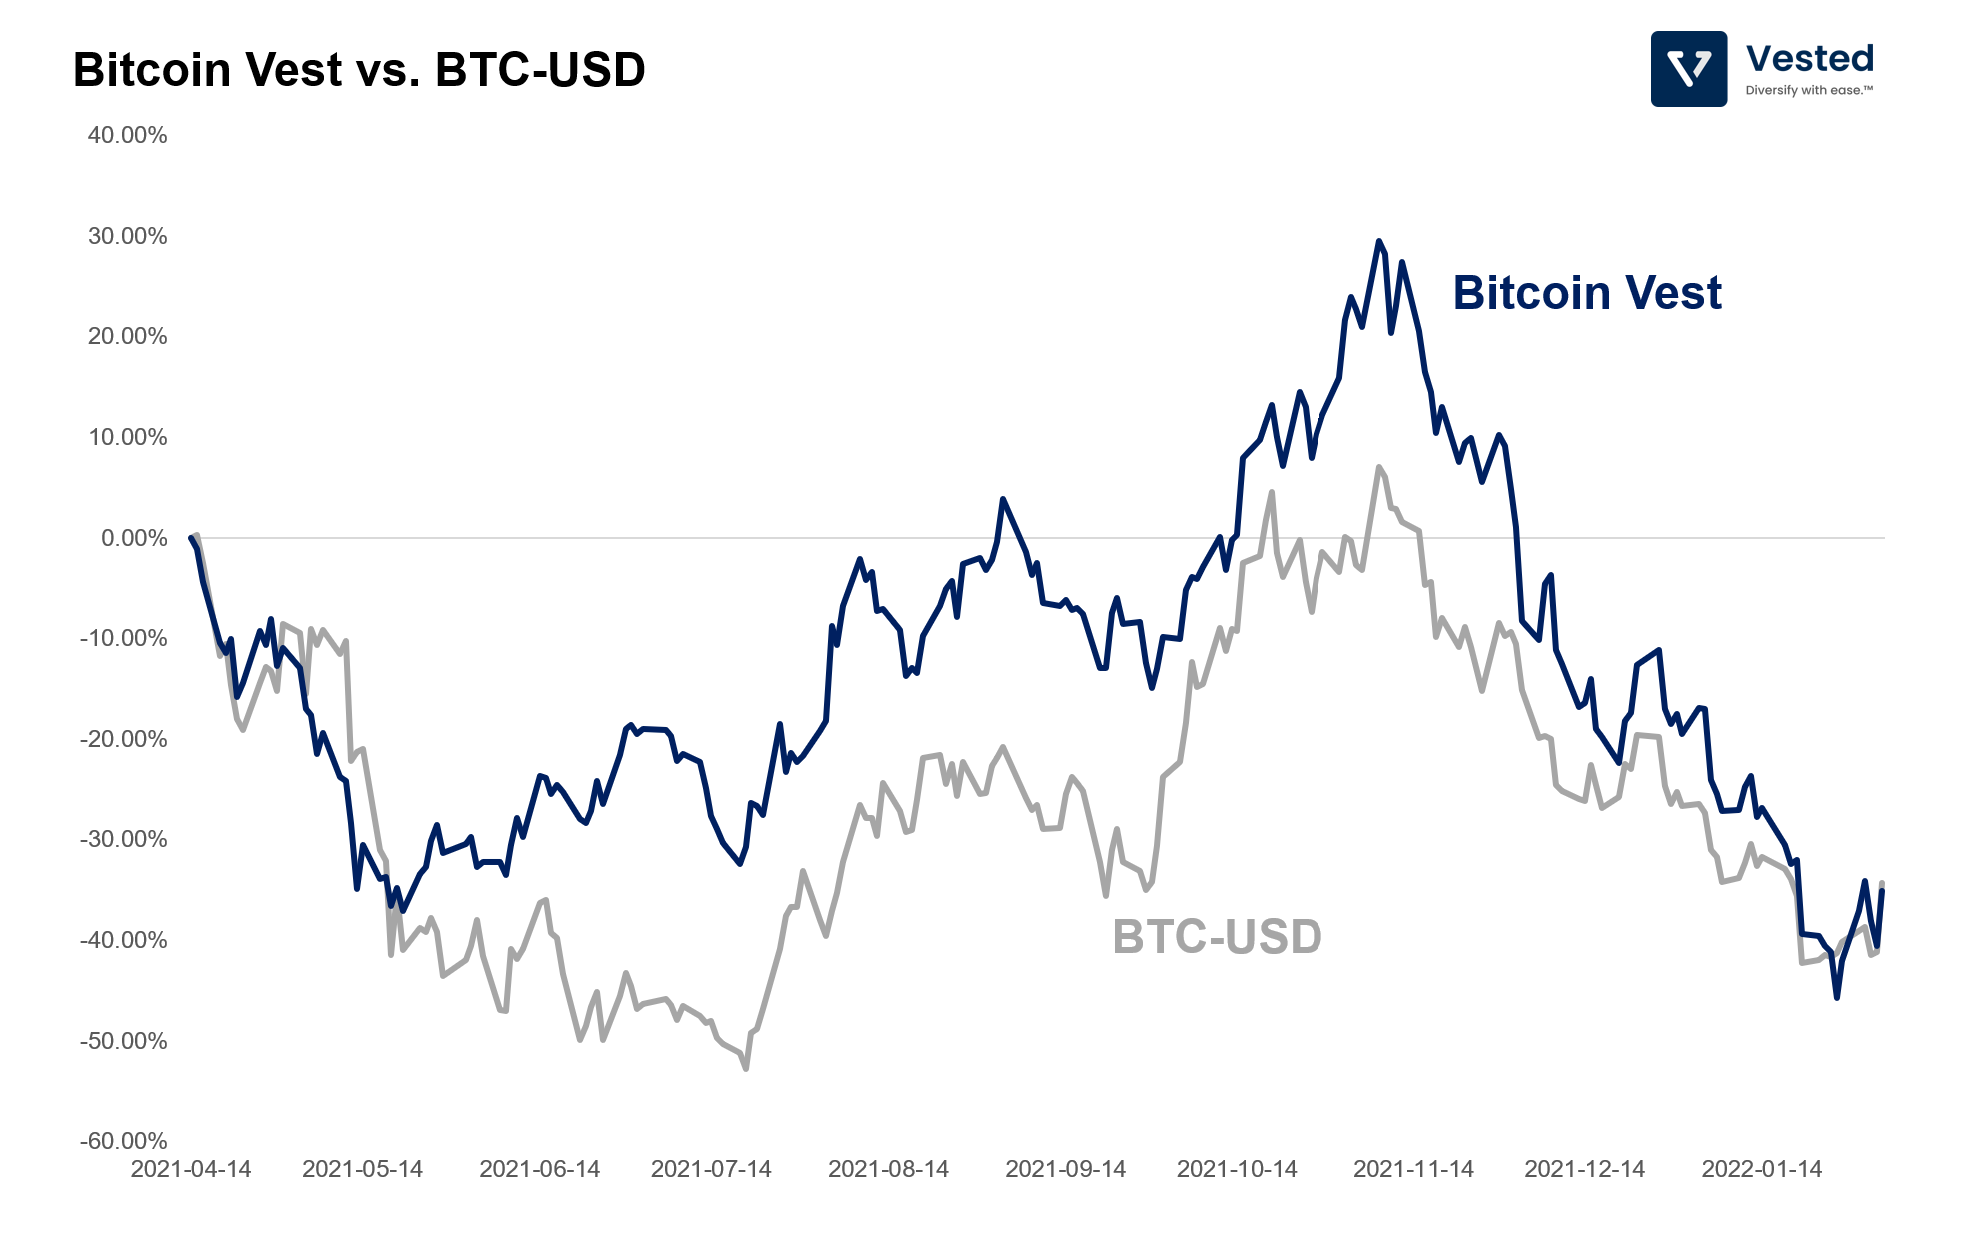
Overall, we were able to achieve a correlation of 0.82 to BTC-USD movement. Because the Bitcoin Vest is intended to track the price of BTC, it is a high risk investment portfolio that has high volatility. From April 2021, the 1-year standard deviation of the daily return is 16%! That’s 16x higher than the S&P 500. This Vest might not be appropriate for everyone.
