




Wall Street has a number problem.
It is called the CAPE ratio. And it just crossed a level that has only been touched five other times in over 150 years of market history.
The last time this happened was right before the dot-com bubble burst.
Let’s get into it.
What is the CAPE ratio anyway
You have probably heard of the P/E ratio. It divides a company’s stock price by its earnings. Simple enough.
The CAPE ratio does something slightly different. Instead of using one year of earnings, it uses an average of the last 10 years, adjusted for inflation. This smooths out the noise. A single blockbuster quarter or one bad year does not swing the number around.
Right now, the S&P 500’s CAPE ratio has closed above 40 for three months running.
That has only happened six times since January 1871.
Every previous time, it ended badly
Here is the uncomfortable part. The five times before this one all preceded serious trouble for the market.
In 1929, right before the Great Depression, the Dow eventually lost 89% of its value from peak to trough.
In 1999, the CAPE hit its highest level ever, just months before the dot-com bubble burst. The S&P 500 fell 49%. The Nasdaq fell a brutal 78%.
In 2018, the ratio crossed 33. The market dropped 20% in the last quarter of that year.
In early 2020, right before COVID hit, the CAPE crossed 30 again. The S&P 500 lost 34% of its value in just 33 calendar days.
In January 2022, the CAPE briefly crossed 40 for the first time ever. What followed was a nine month bear market that cut the Nasdaq by a third.
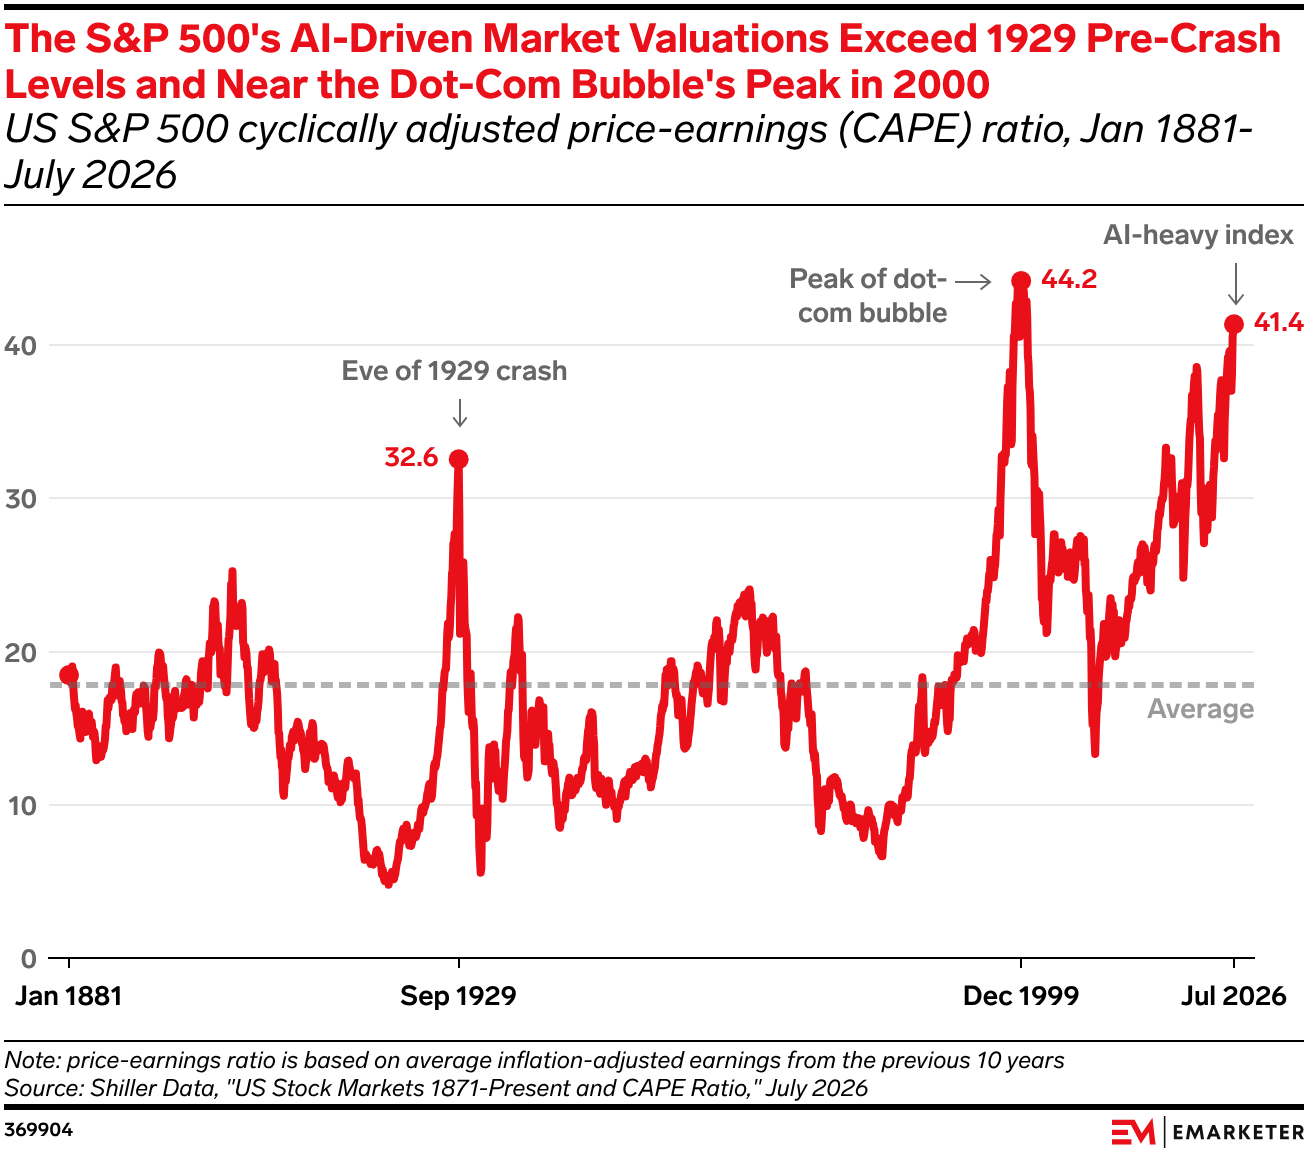
Five for five. Not a great track record for anyone hoping this time plays out differently.
So is this just 1999 all over again
Not quite, and this is where it gets interesting.
The dot-com bubble was built on companies that, in many cases, barely had a business model. Some had no profits. A few did not even have real revenue. Investors were paying for a story, not a balance sheet.
Today’s market looks different on the surface. The companies driving this valuation, Microsoft, Nvidia, Alphabet, Amazon, and the rest of the Mag 7, make enormous amounts of real money. Their earnings can arguably justify a chunk of what investors are paying.
But there is a catch buried underneath this comfortable story.
The entire AI boom does not actually run on the profits of these seven companies. It runs on the frontier AI labs building the models these companies are racing to deploy. And these labs are burning through cash at a scale the business world has genuinely never seen before.
Revenue at these labs is growing fast. Costs are growing faster.
A technology can be genuinely revolutionary and still turn out to be a difficult business. Commercial aviation changed the world completely, and airlines have famously struggled to make consistent money for over a century.
Whether AI ends up in the same bucket is the real question sitting underneath the valuation debate. Nobody knows the answer yet.
What history also tells you
Here is the part that often gets left out of the scary headlines.
While bear markets are painful, they are also short. The average S&P 500 bear market since the Great Depression has lasted around 9.5 months. Not a single 20% or greater downturn has taken longer than 630 calendar days to bottom out.
Bull markets, on the other hand, average around 1,023 calendar days. That is more than three times longer than the typical bear market.
So even if the CAPE ratio is once again foreshadowing trouble, staying invested through the cycle has historically paid off for people who did not panic and sell at the bottom.
The part most investors miss
There is one more thing that rarely makes it into these headlines. This sky-high valuation is not spread evenly across 500 companies.
A small handful of stocks, the Mag 7, are carrying a disproportionate share of the index’s total value. That means when people say they are invested in “the market” through an index fund, they are really making a concentrated bet on a handful of names without fully realizing it.
Here are the numbers. As of August 2026, the Mag 7 make up roughly 32.5% of the entire S&P 500. Add the next three biggest names and the top 10 stocks alone account for close to 40% of the index. The remaining 490 companies share the other 60%.
Compare that to the dot-com peak. At the height of that bubble in 2000, the top 10 stocks in the S&P 500 made up only about 27% of the index. Today’s top 10 concentration is meaningfully higher than it was back then, even though the names involved look far more financially sound on paper.
Nvidia alone now accounts for roughly 21% of the Mag 7’s combined market value, making it the single biggest swing factor inside an already concentrated group.
Borrowed money is piling up too
There is another number worth watching alongside the CAPE ratio. Margin debt, the amount investors borrow from their brokers to buy stocks, hit a record $1.53 trillion in July 2026. That is up more than 50% from a year earlier.
Rapid margin debt growth at this pace has only happened three times before. Right before the dot-com peak in 2000. Right before the 2007 housing peak. And during the speculative frenzy of spring 2021. Each of those episodes was followed by a serious market downturn.
None of this means a crash is coming on any particular date. Margin debt and CAPE ratios are not precise timing tools. But together, they paint a picture of a market that is expensive, concentrated, and increasingly leveraged, all at the same time.
Understanding exactly how concentrated the US market has become, and what that means for how you build a portfolio, is something every Indian investor putting money into US stocks should know before they invest, not after a correction forces them to find out.
This article is for educational purposes only and does not constitute investment advice. Past performance is not indicative of future results.
